
Jupiter price prediction as JUP clears 200-day EMA on revenue-driven rally

Jupiter has surged more than 15% after a sharp rebound in June protocol revenue revived bullish sentiment despite persistent risk-off conditions across the crypto market.
- Jupiter jumped more than 15% after June protocol revenue climbed to a three-month high.
- Technical indicators show JUP has reclaimed its 200-day EMA as open interest and funding rates strengthened.
- Bulls now target the $0.24-$0.26 range, while losing $0.218 support could revive selling pressure.
According to data from crypto.news, Jupiter (JUP) traded around $0.233 at the time of writing after briefly touching an intraday high near $0.238, extending its weekly gain to almost 30%.
The token’s rally followed a sharp improvement in protocol activity during June. Data from DeFiLlama showed Jupiter generated 261,909 SOL in user fees and 76,257 SOL in protocol revenue during the month, reversing three consecutive months of weakening network activity.
Because a portion of protocol revenue feeds Jupiter’s staking and governance model, the jump in cash flow quickly translated into renewed demand for the token.
The move also arrived while risk appetite across digital assets remained subdued. The Crypto Fear & Greed Index has continued to hover in Extreme Fear territory near 11 as macro uncertainty and tighter liquidity conditions keep investors selective toward altcoins. Jupiter nevertheless outperformed most large-cap tokens, suggesting traders have prioritized protocol-specific fundamentals over macro headwinds.
Derivatives traders joined the advance rather than fading it. Open interest climbed roughly 11% to $58.7 million, while funding rates stayed positive near 0.0021%, showing leveraged traders have continued paying a premium to maintain long exposure instead of aggressively hedging the rally. That combination generally supports sustained momentum as long as fresh buying continues to absorb profit-taking.
Bulls have reclaimed the long-term trend while momentum targets higher resistance
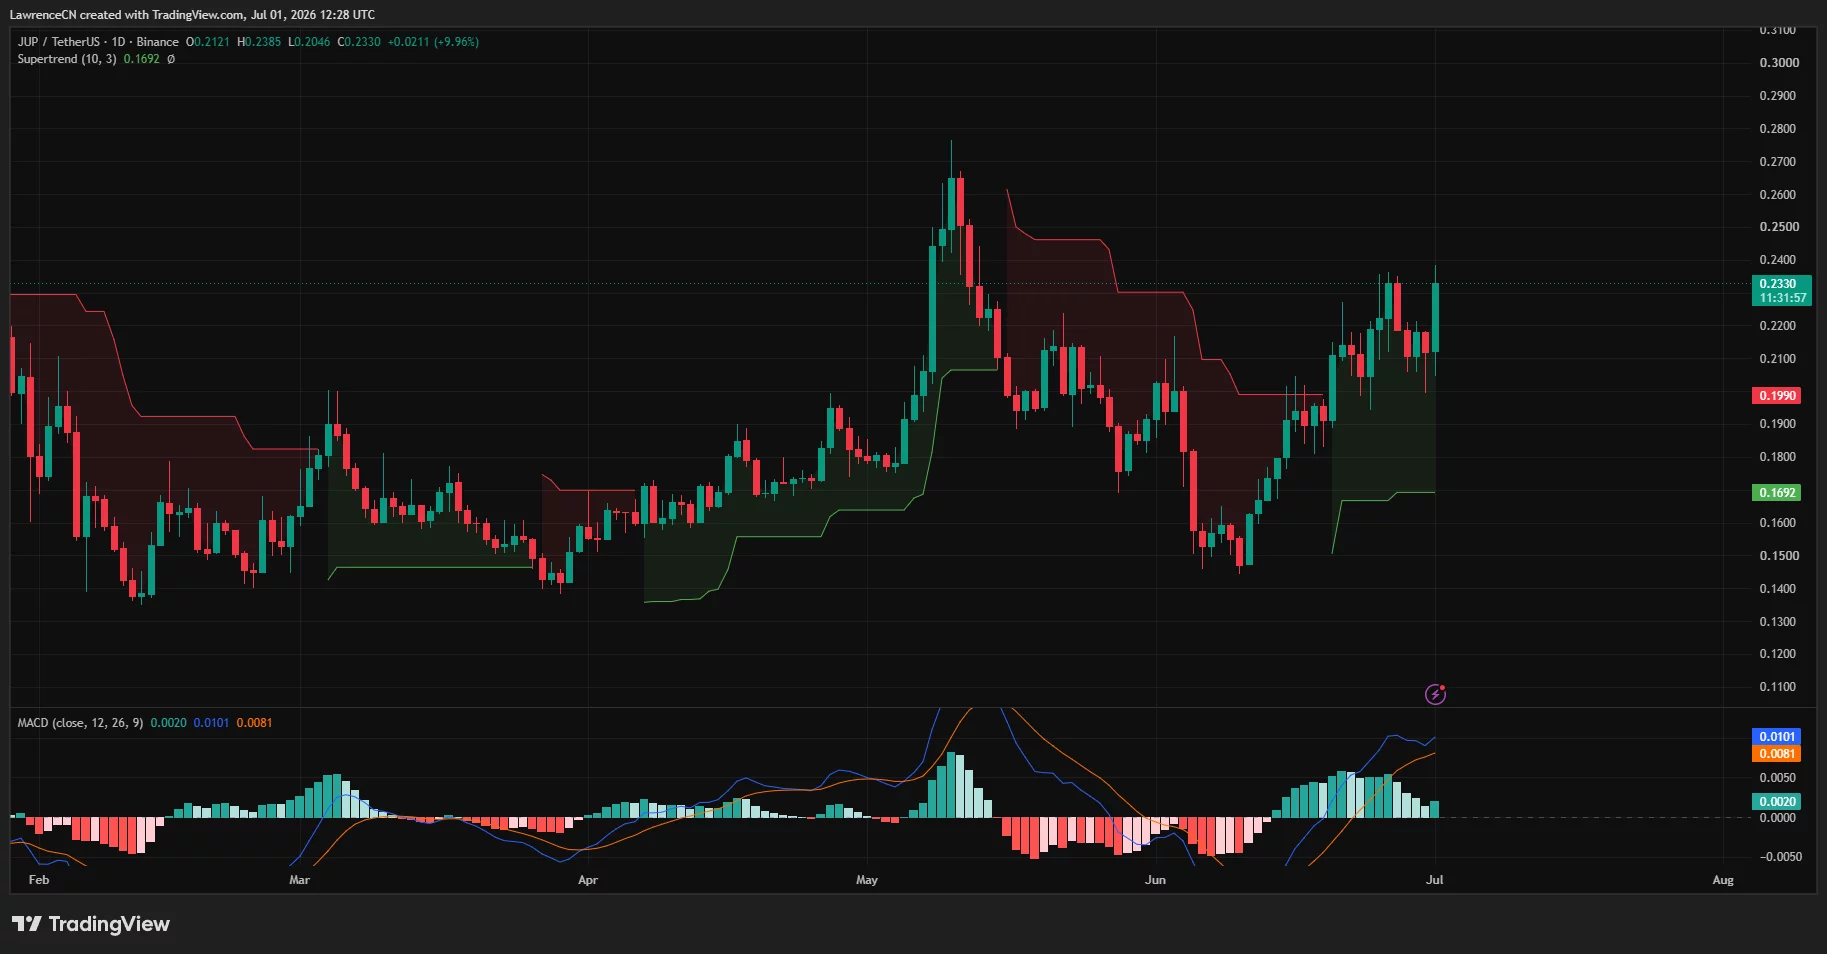
The daily chart shows JUP has reclaimed its 200-day exponential moving average around $0.219, a level that repeatedly rejected advances during the previous decline. Price has also remained comfortably above the daily Supertrend indicator near $0.169, preserving the bullish structure established after June’s recovery.
 Jupiter daily price chart — July 1 | Source:
crypto.news
Jupiter daily price chart — July 1 | Source:
crypto.news
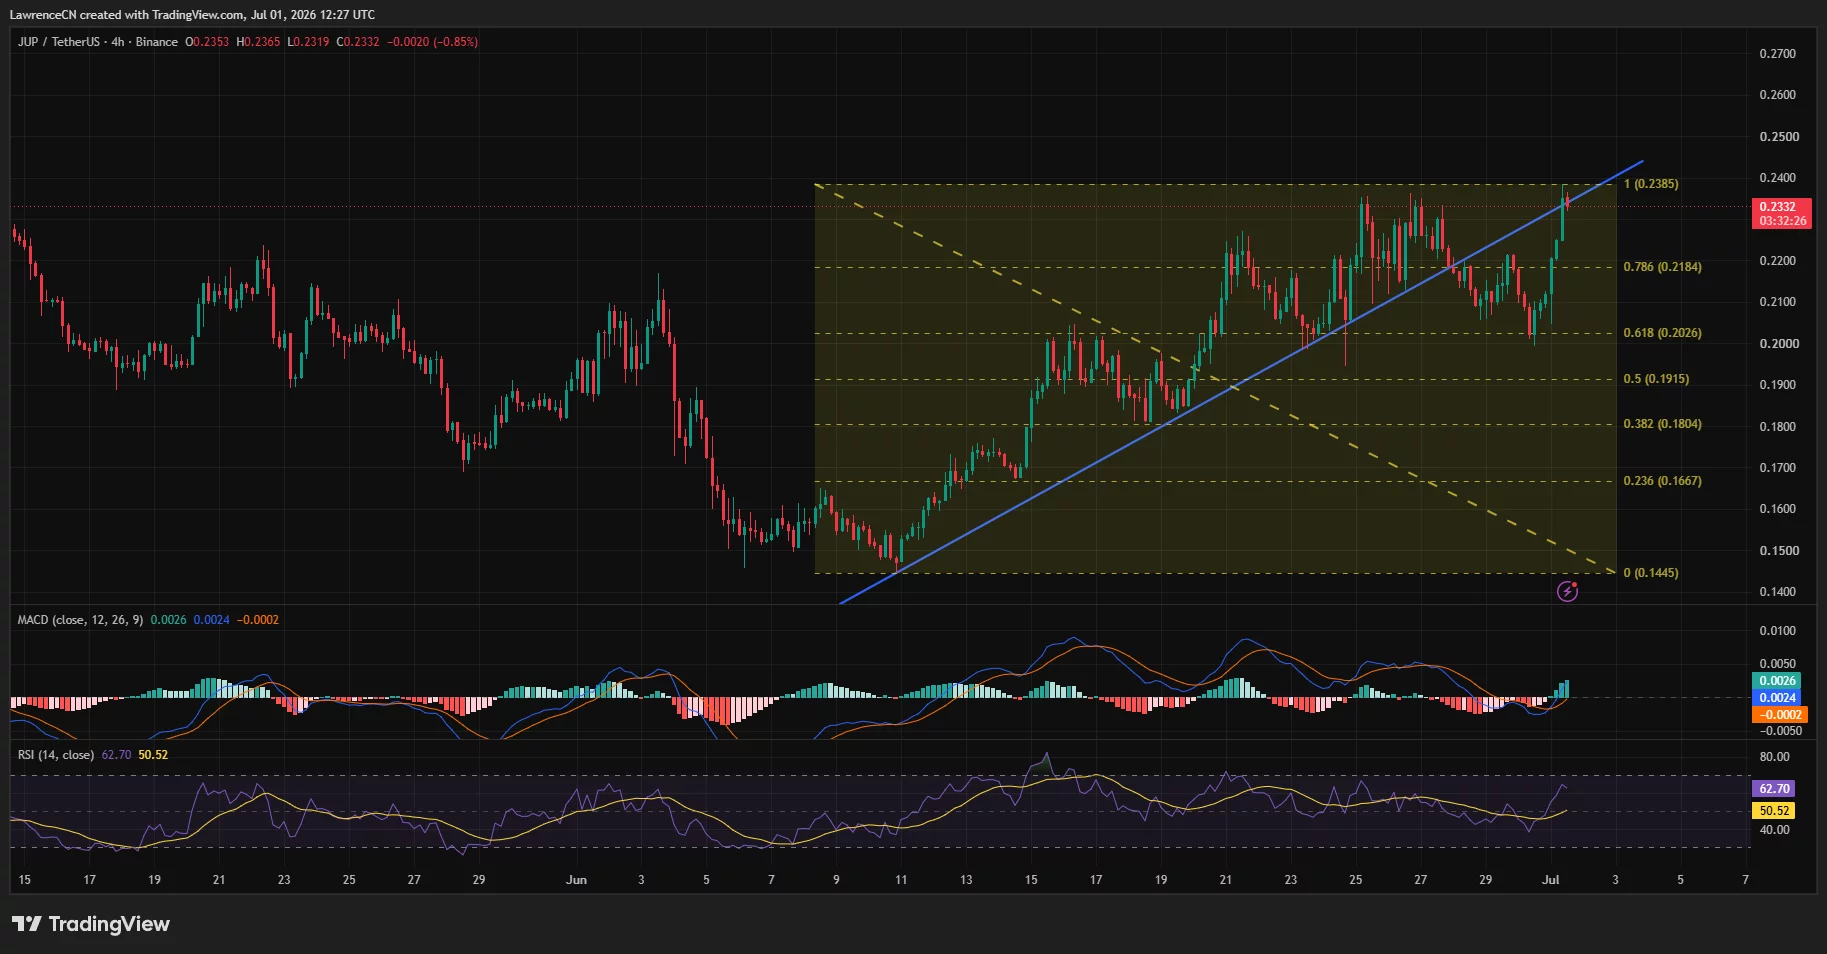
Momentum indicators continue to favor buyers. The daily MACD remains above its signal line despite a modest slowdown in histogram expansion, suggesting upside momentum has eased but has not reversed. On the four-hour chart, RSI has climbed to about 63 without entering overbought territory, while the MACD has completed another bullish crossover as price pushes back toward the recent swing high.
The 4-hour structure also shows JUP trading above an ascending trendline that has supported higher lows since early June. Fibonacci retracement levels place immediate resistance near $0.238, followed by the psychological $0.24 region. A decisive close above that zone could expose the May peak around $0.26, while the 0.786 Fibonacci level near $0.218 now serves as the first important support during any pullback.
 Jupiter 4-hour price chart — July 1 | Source:
crypto.news
Jupiter 4-hour price chart — July 1 | Source:
crypto.news
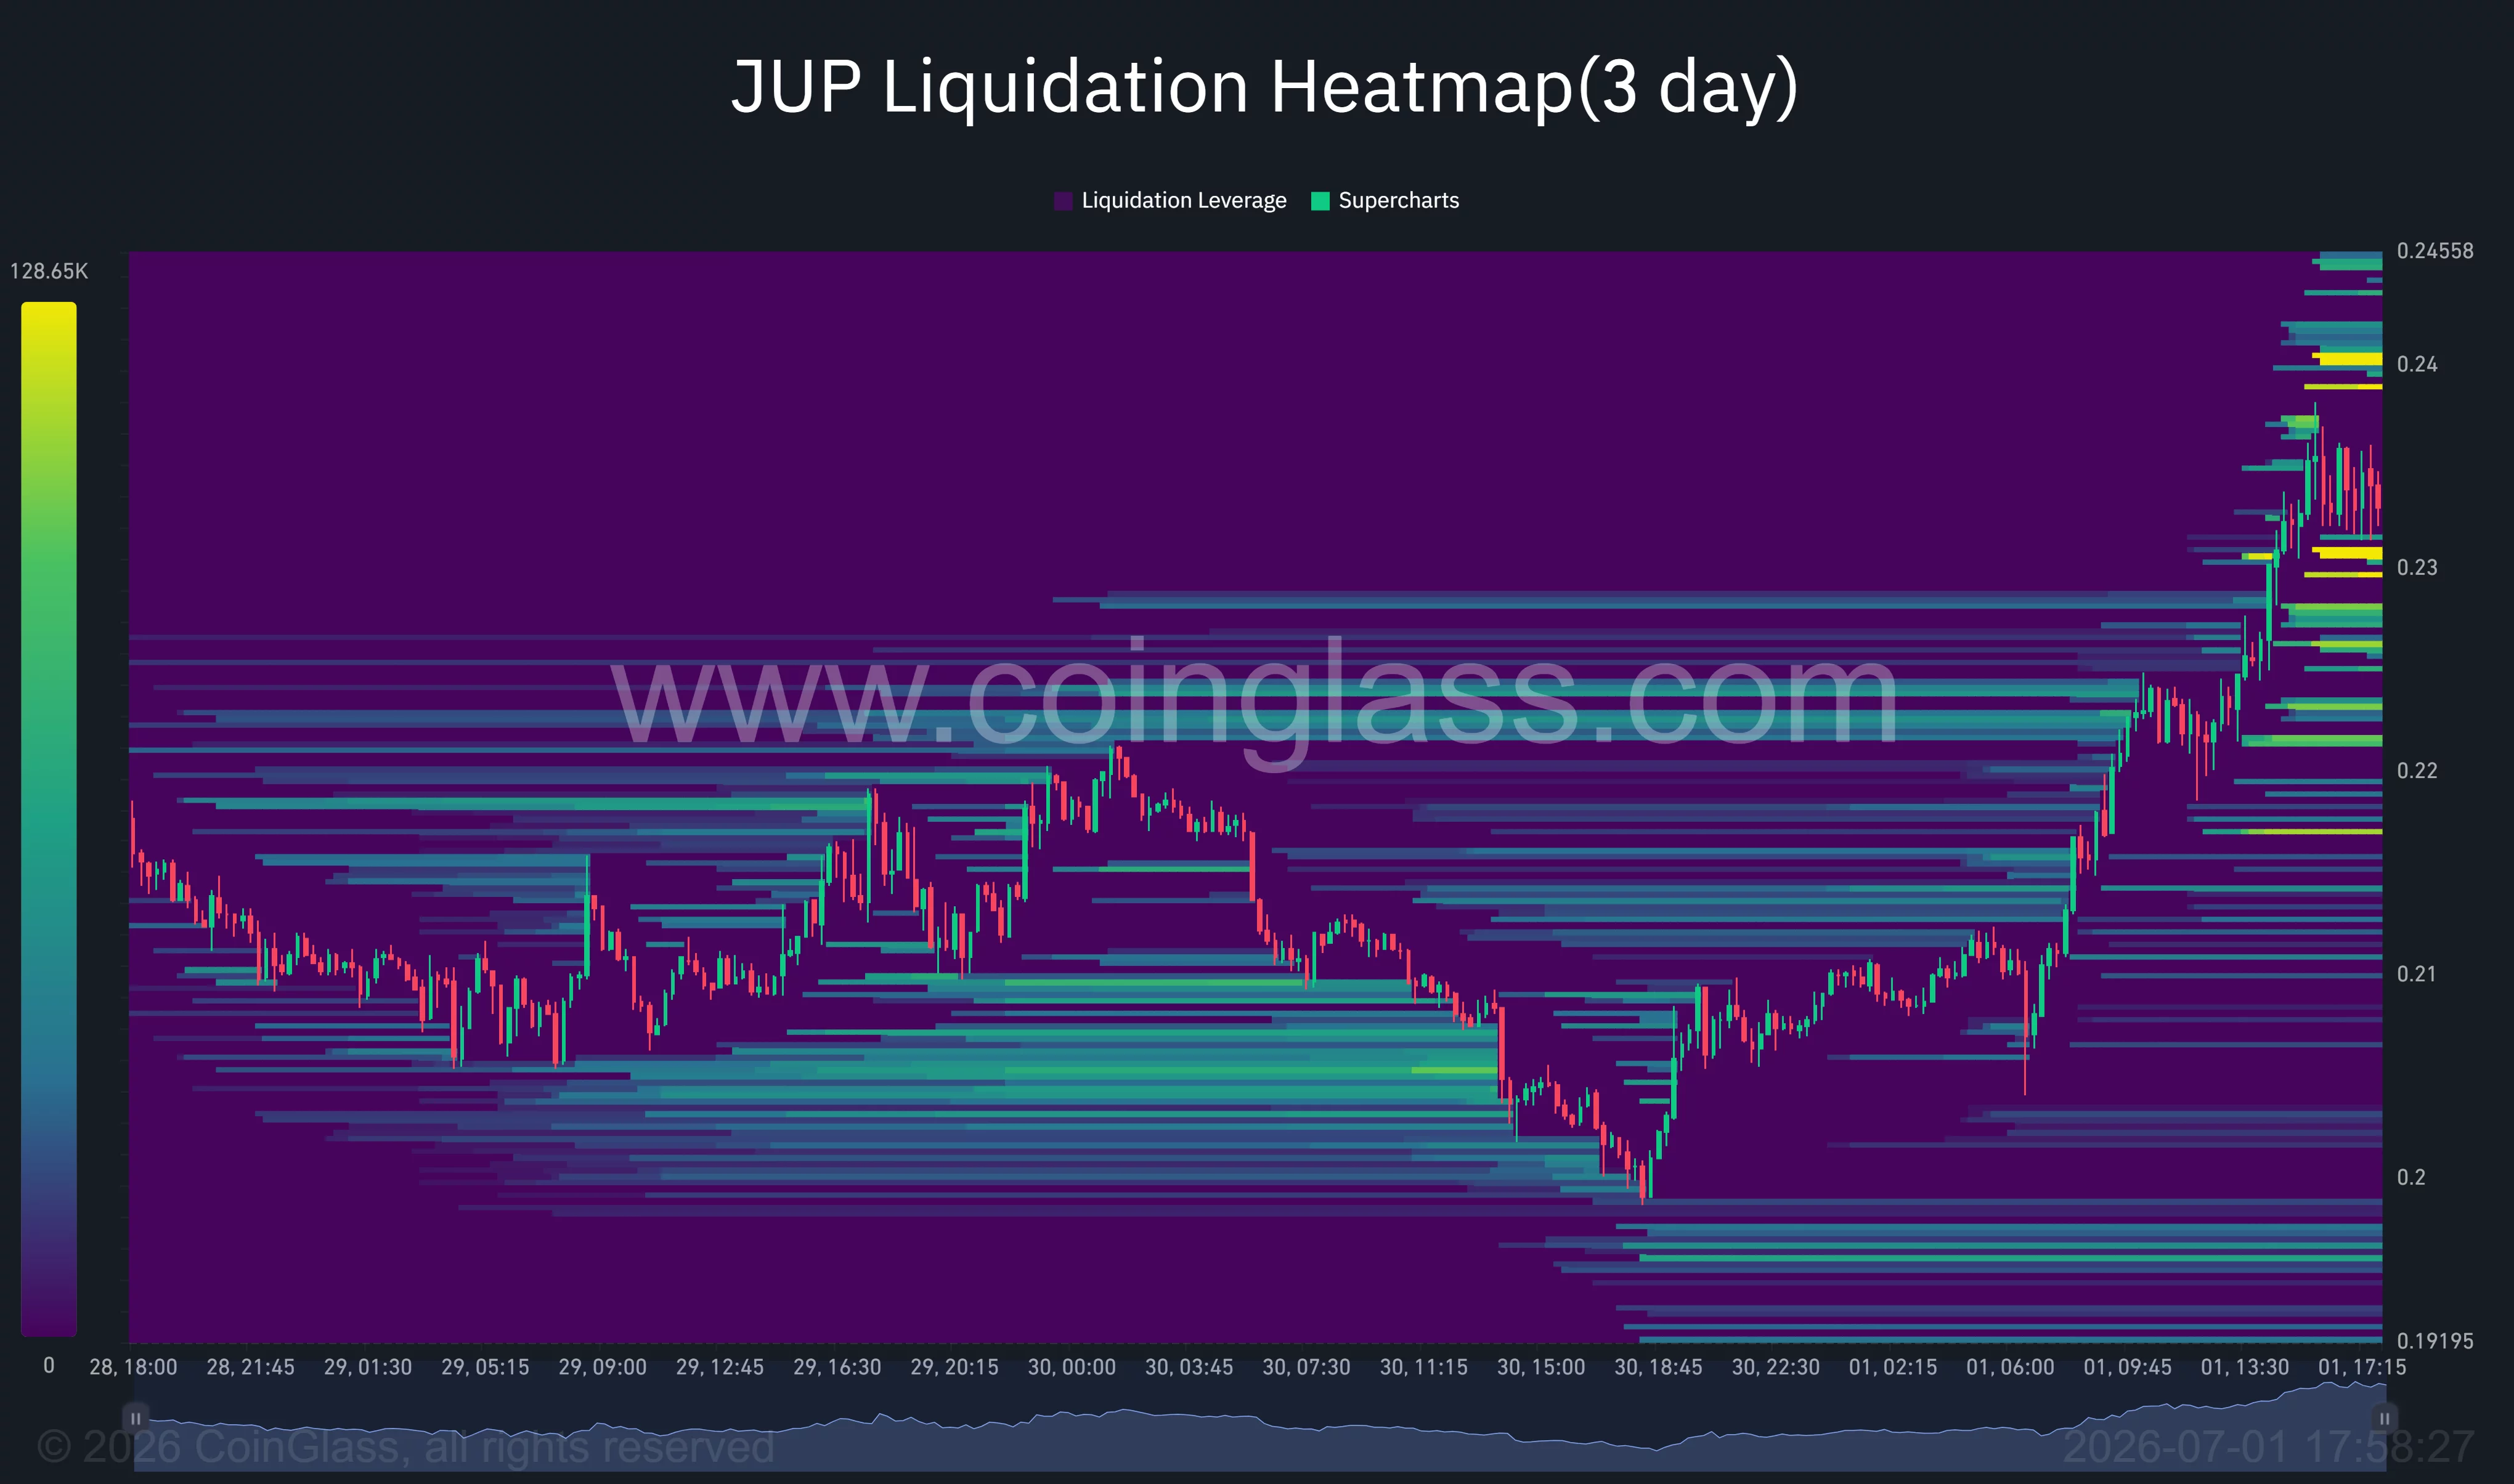
CoinGlass liquidation data reinforces those technical levels. The largest concentration of short liquidations sits between roughly $0.238 and $0.245, creating a potential liquidity pocket if buyers force another breakout. Below the market, notable long liquidation clusters have formed around $0.22 and $0.21, areas that could attract buyers if price retraces before attempting another advance.
 Jupiter liquidation heatmap | Source:
Failure to hold support could revive the previous bearish trend
The bullish outlook would weaken if JUP loses the ascending trendline and falls back below the former breakout zone around $0.218. Such a move would place the 200-day EMA under pressure again and increase the probability of a decline toward the $0.20-$0.19 region, where the 0.5 Fibonacci retracement aligns with previous consolidation.
Macro risks also remain in place despite Jupiter’s strong fundamentals. Persistent risk-off sentiment, reduced liquidity across crypto markets, or renewed weakness in Solana ecosystem tokens could limit follow-through buying. Without continued growth in protocol revenue and sustained derivatives participation, the latest breakout could lose momentum before challenging the next major resistance zone above $0.24.
Disclaimer: The content of this article solely reflects the author's opinion and does not represent the platform in any capacity. This article is not intended to serve as a reference for making investment decisions.
You may also like
As AI controversies escalate, hedge funds buy tech stocks at the fastest pace in 15 months
Hedge funds have recorded net purchases of US TMT stocks on 10 out of the past 11 trading days, rebuilding tech long positions at the fastest pace in 15 months. However, an AI policy storm has struck at the "worst possible time"—calls by AI giants to slow down development have been rejected, and regulatory uncertainty has directly hit Asian tech stocks such as Softbank. As the tech sector's bullish run coincides with Super Central Bank Week, the sector now faces a severe test.
Apple Pre-sale Tracker: iPhone 18 Pro Series Shows Weak Overseas Demand Signals, Duo Review Positive but Hardware Lags Behind
According to a survey by Jefferies, after the launch of the iPhone 18 Pro, delivery wait times in the four major markets—the US, UK, Germany, and Japan—have shortened by 5 to 11 days compared to last year, with no wait time in the US. Given stable production capacity, this is a clear sign of weak demand. Although the China and Hong Kong markets have performed better against the trend, there are still suspicions of speculative stockpiling. The new foldable Duo has been praised for its software experience, but its $2,000 price tag comes with a 254-gram body and dual-camera setup, leaving its hardware lagging significantly behind Android competitors. Jefferies maintains an "underperform" rating, with a target price implying a 21% downside from the current level.
SUI holds $0.71 support as analysts cite key buy signal, eyes on possible recovery
UBS Health Benefit Survey: Elevance Health (ELV.US) Leads, U.S. Employers Prepare for Rising Medical Costs
In the annual survey by UBS for employee benefits management institutions, Elevance Health (ELV.US) emerged as the highest-rated US health insurance company.

Crypto prices
More


