
A Chart Overview of Commodity Support and Resistance: Gold, Silver, Oil, Gas + Platinum, Palladium, Copper, Agricultural Futures (July 3, 2026)

Huitong Finance July 3 ——— An overview chart of commodity support and resistance: gold, silver, oil, gas + platinum, palladium, copper + agricultural futures, updated at 07:20 on Friday, July 3, 2026 (UTC+8), specifically covering 14 varieties including gold, silver, platinum, palladium, copper + crude oil, natural gas, fuel oil + wheat, corn, and cotton. For more details, refer to the special chart produced by Huitong Finance Analyzer.
An overview chart of commodity support and resistance: gold, silver, oil, gas + platinum, palladium, copper + agricultural futures, updated at 07:20 on Friday, July 3, 2026 (UTC+8), specifically covering 14 varieties including gold, silver, platinum, palladium, copper + crude oil, natural gas, fuel oil + wheat, corn, and cotton. For more details, refer to the special chart produced by Huitong Finance Analyzer.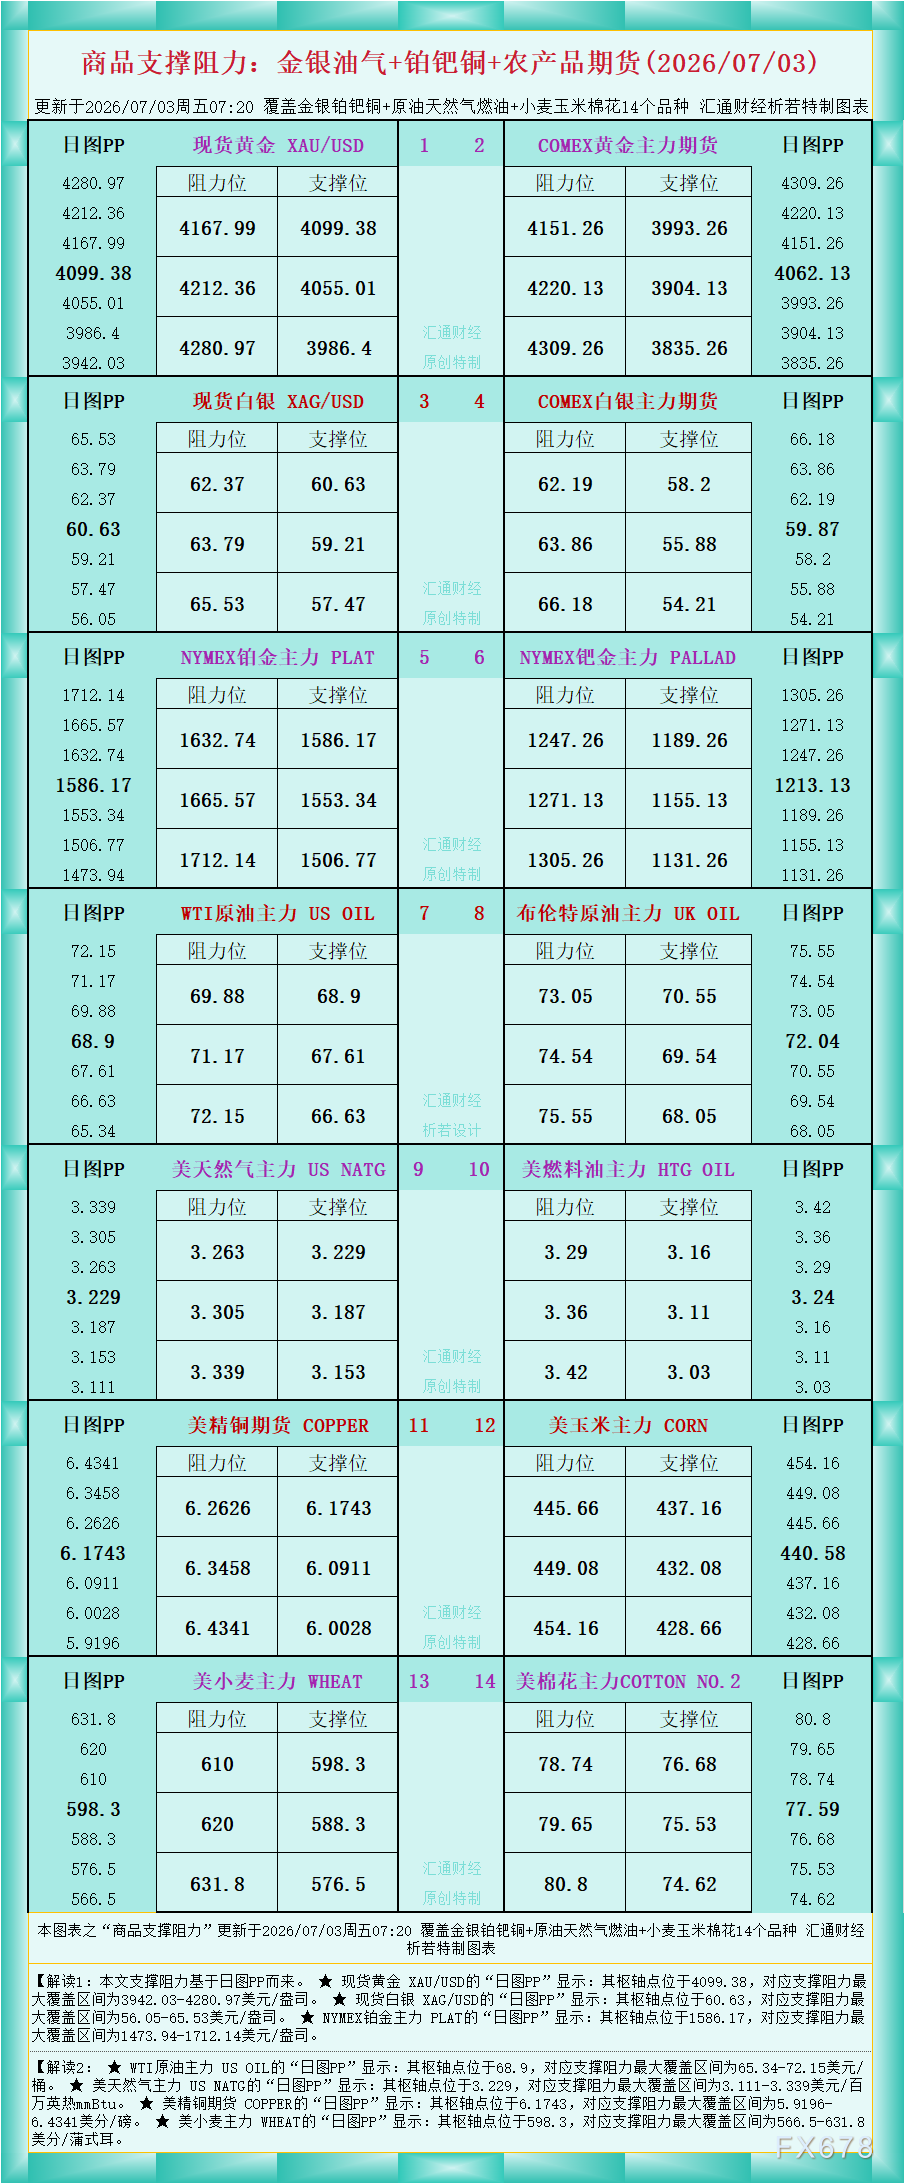
According to the chart data, Interpretation 1: The support and resistance levels in this article are based on daily chart PP.
★ The daily chart PP for spot gold XAU/USD shows: the pivot point is at 4099.38, with the maximum support and resistance range between $3942.03-$4280.97/oz.
★ The daily chart PP for spot silver XAG/USD shows: the pivot point is at 60.63, with the maximum support and resistance range between $56.05-$65.53/oz.
★ The daily chart PP for NYMEX platinum main contract PLAT shows: the pivot point is at 1586.17, with the maximum support and resistance range between $1473.94-$1712.14/oz.
Interpretation 2:
★ The daily chart PP for WTI crude oil main contract US OIL shows: the pivot point is at 68.9, with the maximum support and resistance range between $65.34-$72.15/barrel.
★ The daily chart PP for US natural gas main contract US NATG shows: the pivot point is at 3.229, with the maximum support and resistance range between $3.111-$3.339 per million British thermal units (mmBtu).
★ The daily chart PP for US copper futures COPPER shows: the pivot point is at 6.1743, with the maximum support and resistance range between 5.9196-6.4341 cents/pound.
★ The daily chart PP for US wheat main contract WHEAT shows: the pivot point is at 598.3, with the maximum support and resistance range between 566.5-631.8 cents/bushel.
For more product interpretations, see the chart.
Disclaimer: The content of this article solely reflects the author's opinion and does not represent the platform in any capacity. This article is not intended to serve as a reference for making investment decisions.
You may also like
Japanese Yen trims part of intraday gains vs retreating USD as traders await US PCE data
What Happens to Bitcoin, Gold and Stocks When Bond Yields Rise?
SEC Issues "No-Objection Framework Letter": Retail Investors Can Authorize Once and Default to Board Voting; Tesla (TSLA.US) Gets Template First
The U.S. Securities and Exchange Commission has approved a plan allowing Tesla retail shareholders to automatically vote jointly with the board of directors, which was applauded by the CEO of Robinhood.
Bitwise's NEAR ETF Goes Live With $562 Target by 2030
Crypto prices
More


