
Have U.S. tech stocks adjusted enough?

1. Previously, we reported that the maximum drawdown of the Nasdaq during the tech rally and the current AI rally averaged around 10% (In previous technology rallies, how long and how deep were the corrections?). However, given the current divergence between hardware and software, we further analyzed the maximum drawdown patterns of the Philadelphia Semiconductor Index and momentum factors, which better represent the current AI rally.
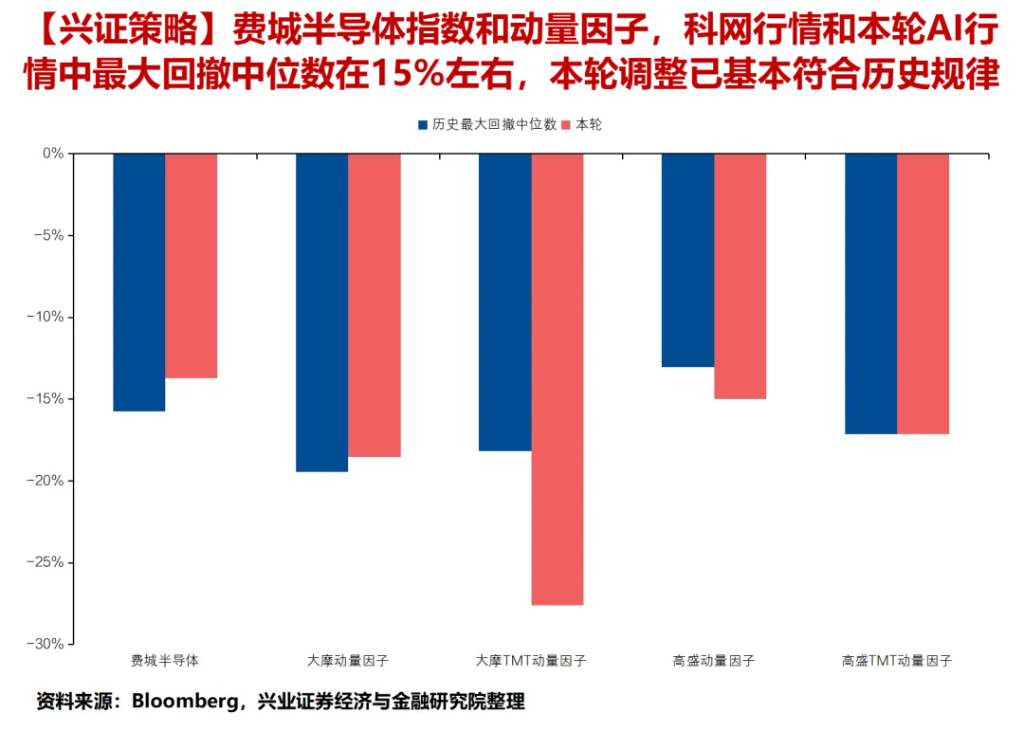
2. Since June 22, the drawdown magnitude for the Philadelphia Semiconductor Index and momentum factors is broadly in line with historical norms. During both the 1995-2000 tech rally and since the AI rally began in December 2022, the median maximum drawdown for the Philadelphia Semiconductor Index, Morgan Stanley Momentum Factor, Morgan Stanley TMT Momentum Factor, and Goldman Sachs Momentum Factors is generally around 15%. The correction since June 22 is also broadly consistent with this historical pattern.
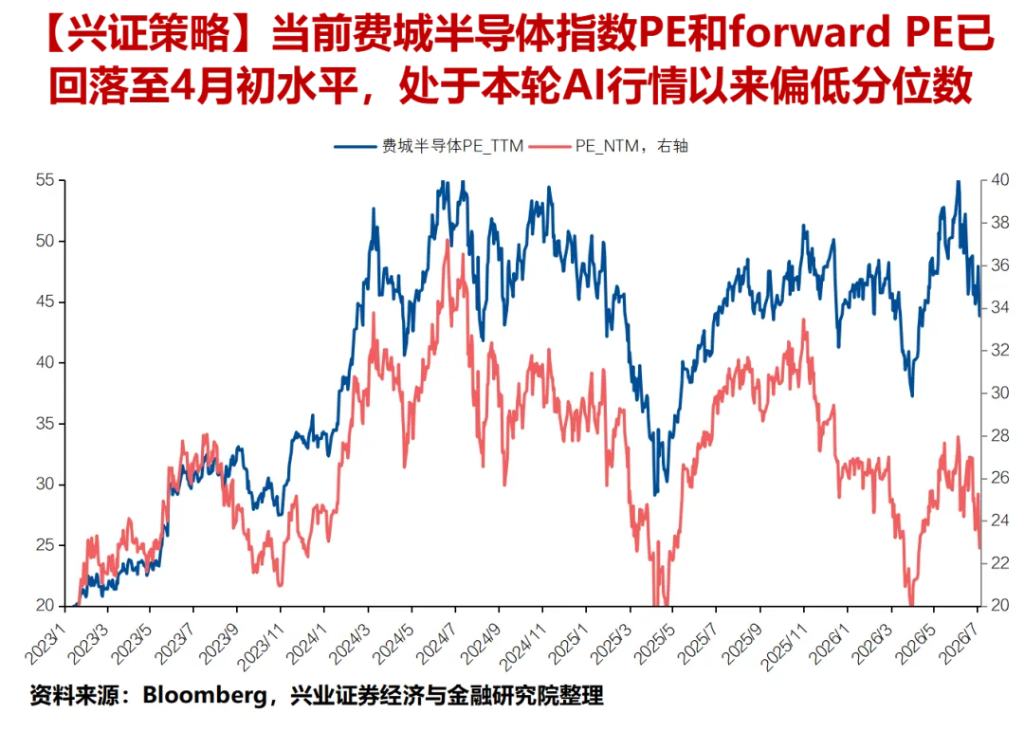
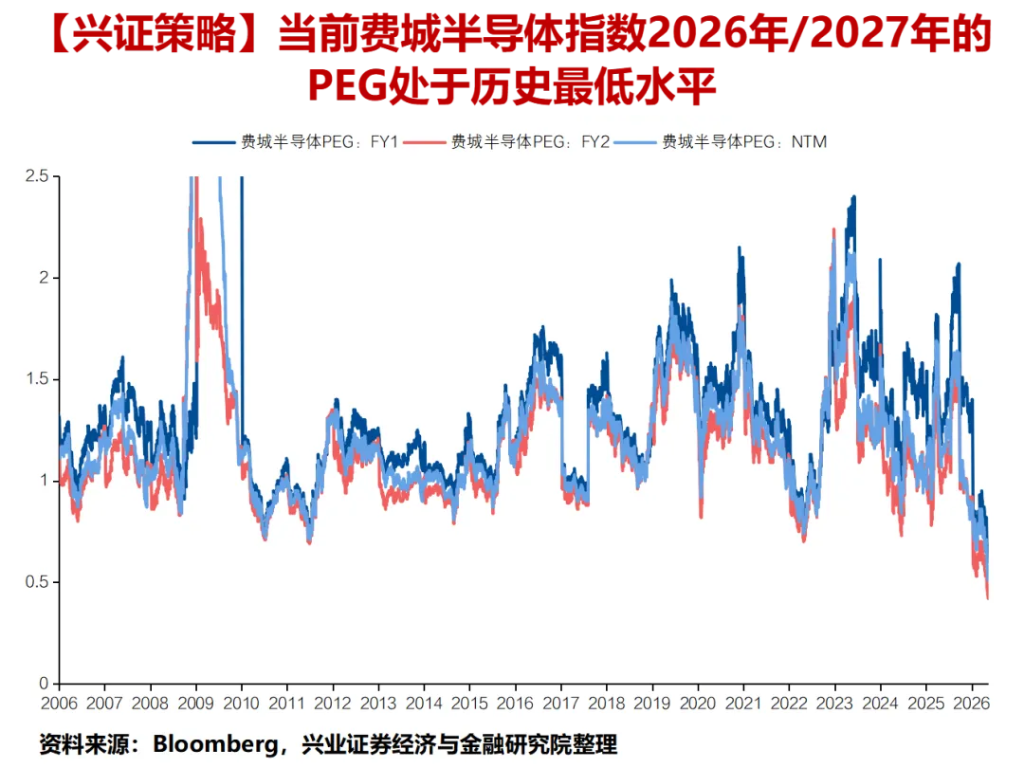
3. The valuation of the Philadelphia Semiconductor Index has fallen back to early April levels; the 2026/2027 PEG is at a historical low, and the current valuation has not yet priced in long-term earnings growth. As of the latest data, the Philadelphia Semiconductor Index's TTM and Forward PE are 43.9x and 22.7x, basically returning to the level seen right after the US-Iran ceasefire agreement in early April, standing only at the 48.3% and 16.9% percentiles since the start of the current AI rally. In addition, the 2026/2027 PEGs for the Philadelphia Semiconductor Index are 0.6/0.4, also at historical lows, indicating that the current valuation has not yet priced in long-term earnings growth.
Disclaimer: The content of this article solely reflects the author's opinion and does not represent the platform in any capacity. This article is not intended to serve as a reference for making investment decisions.
You may also like
Despite falling oil prices and dovish comments from Fed officials, US Treasury yields continue to rise
The wave of US Treasury sell-offs continues to spread, with the 30-year yield reaching a 24-year high of 5.621% and the 10-year yield rising to its highest level since 2002—oil price declines and dovish signals have both failed, and long-term rates remain unaffected. High yields are reshaping the structure of US equities; as the AI narrative becomes the market’s final pillar, any cracks could trigger a chain reaction of turbulence.
Morgan Stanley trading desk, dubbed the "most accurate in the past two years," turns bullish
The supporting logic encompasses five major pillars: unexpected macro trends, consumer resilience, low profit expectations, stabilized yields, and technical improvements. Since the previous shift on August 31, the Nasdaq 100 long and Russell 2000 short paired trades have accumulated gains of over 8%. This latest "bullish reversal" is even more convincing. Strategically, technology remains the core long position, but the hedging tool has shifted from shorting RTY to derivatives. Meanwhile, the risk of long-term interest rate hikes still persists.

Four major favorable factors emerge, international oil prices respond by falling
Crypto prices
More


