
A Visual Guide to Commodity Support and Resistance: Gold, Silver, Oil, Gas + Platinum, Palladium, Copper, and Agricultural Futures (July 7, 2026)

FXAlliance July 7th—— A single chart summarizing support and resistance for commodities: gold, silver, oil & gas + platinum, palladium, copper + agricultural futures, updated at 06:45 (UTC+8) on Tuesday, July 7, 2026. Specifically covering 14 products including gold, silver, platinum, palladium, copper, crude oil, natural gas, fuel oil, wheat, corn, and cotton. For more details, refer to the special chart in the FXAlliance Analytics report.
A single chart summarizing support and resistance for commodities: gold, silver, oil & gas + platinum, palladium, copper + agricultural futures, updated at 06:45 (UTC+8) on Tuesday, July 7, 2026. Specifically covering 14 products including gold, silver, platinum, palladium, copper, crude oil, natural gas, fuel oil, wheat, corn, and cotton. For more details, refer to the special chart in the FXAlliance Analytics report.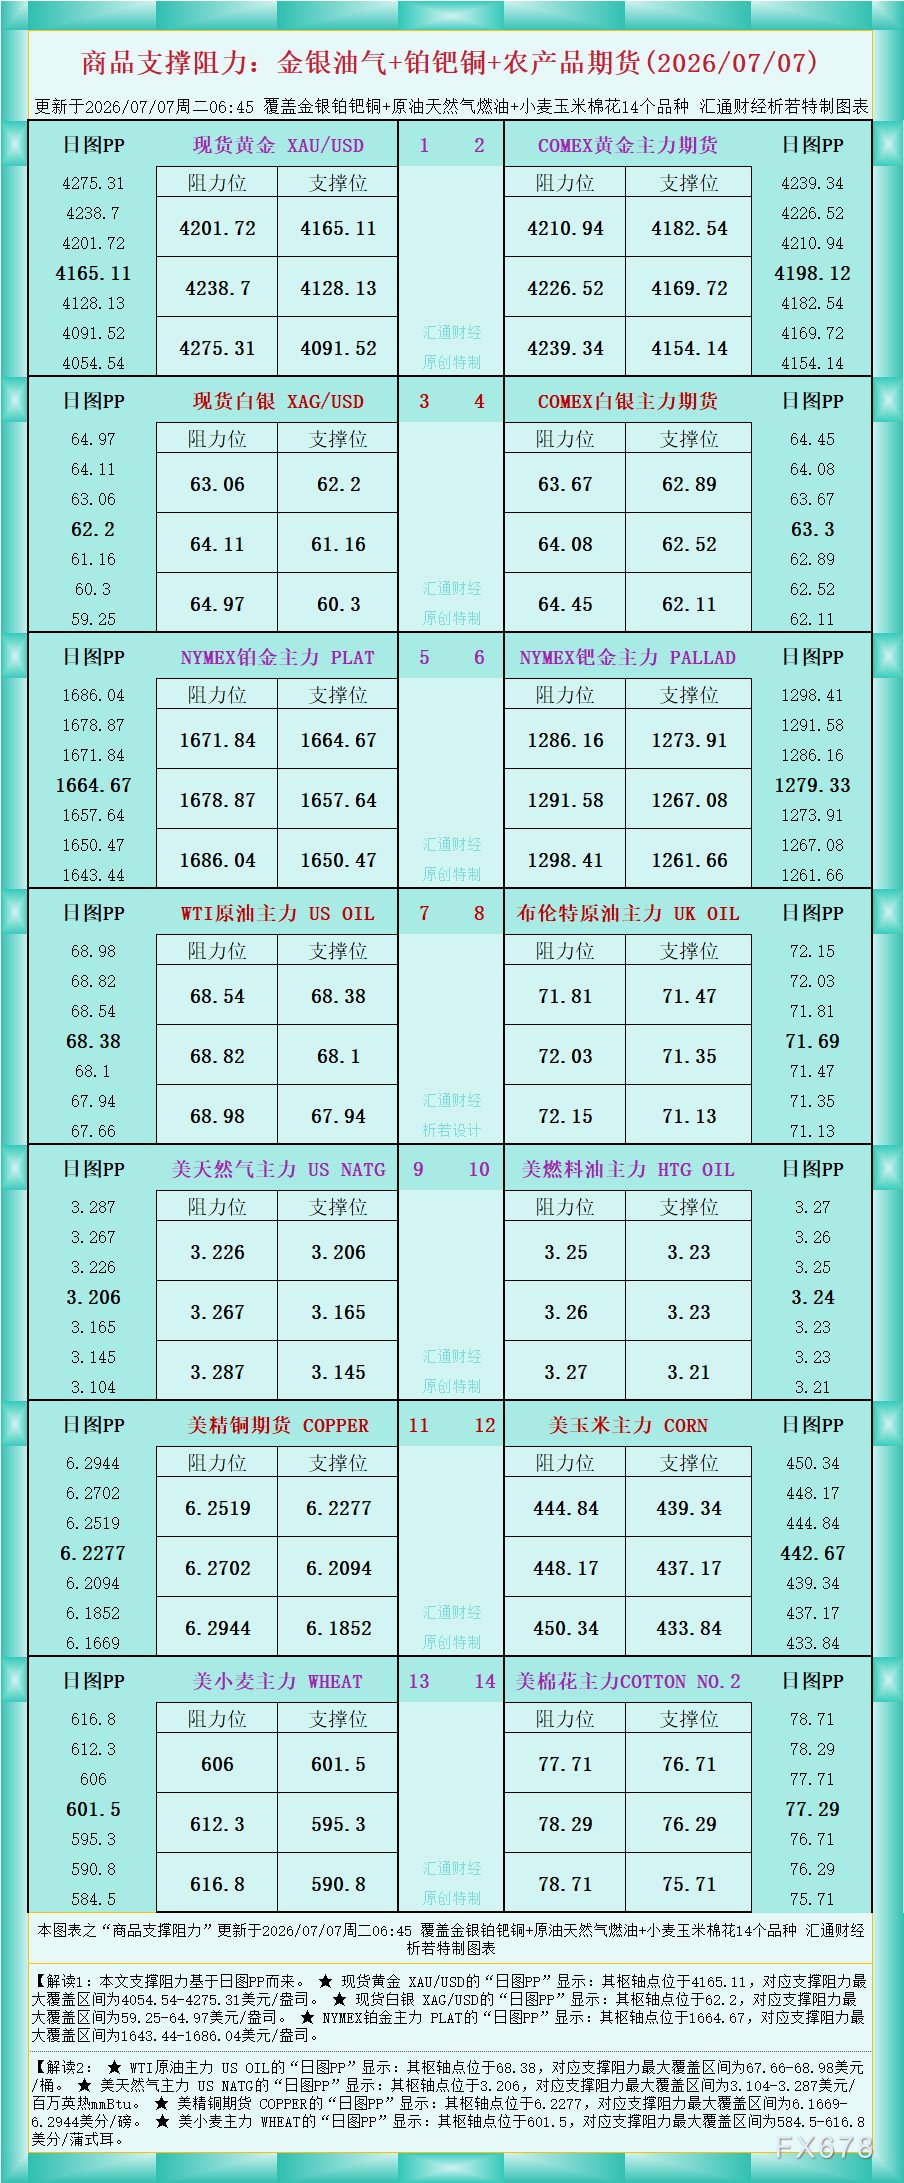
According to the chart data, Interpretation 1: The support and resistance levels in this article are based on the Daily PP indicator.
★ The Daily PP for spot gold XAU/USD shows: the pivot point is at 4165.11, with the widest range for support and resistance between 4054.54 and 4275.31 USD/ounce.
★ The Daily PP for spot silver XAG/USD shows: the pivot point is at 62.2, with the widest range for support and resistance between 59.25 and 64.97 USD/ounce.
★ The Daily PP for NYMEX platinum main contract PLAT shows: the pivot point is at 1664.67, with the widest range for support and resistance between 1643.44 and 1686.04 USD/ounce.
Interpretation 2:
★ The Daily PP for WTI crude oil main contract US OIL shows: the pivot point is at 68.38, with the widest range for support and resistance between 67.66 and 68.98 USD/barrel.
★ The Daily PP for US natural gas main contract US NATG shows: the pivot point is at 3.206, with the widest range for support and resistance between 3.104 and 3.287 USD/MMBtu.
★ The Daily PP for US copper futures COPPER shows: the pivot point is at 6.2277, with the widest range for support and resistance between 6.1669 and 6.2944 cents/pound.
★ The Daily PP for US wheat main contract WHEAT shows: the pivot point is at 601.5, with the widest range for support and resistance between 584.5 and 616.8 cents/bushel.
For more product analysis, please refer to the chart.
Disclaimer: The content of this article solely reflects the author's opinion and does not represent the platform in any capacity. This article is not intended to serve as a reference for making investment decisions.
You may also like

Anthropic Roadshow PPT: "Computing Power" Mentioned 49 Times, "Safety" 27 Times; Revenue Grows 12 Times in a Year, Long-term Profit Margin Target at 35%
In Anthropic's IPO roadshow video, "computing power" was mentioned 49 times, and "security"-related terms were mentioned 27 times; the CEO mentioned the risk of biological weapons within about 30 seconds of the opening speech. The PPT shows that third-quarter revenue was $16.956 billion, a year-on-year increase of over 12 times, adjusted operating profit margin was 15% (GAAP: -3%), computing power commitments were about $900.9 billion, and the long-term profit margin target is above 35%.

SoftBank suffers a massive $7.1 billion loss, stock price plunges 11%! Masayoshi Son’s AI ambitions challenged by power supply and financing costs
After SoftBank Group reported its first net loss in nearly two years, its share price fell as much as 11%. The loss was attributed to a $3.7 billion write-down on its U.S. data center project and a decline in AI valuations. On Wednesday, the stock fell as low as 3,465 yen during Tokyo trading. The company reported a loss of 1.12 trillion yen (approximately $7.1 billion) for the second quarter.
Crypto prices
More


