
A Chart: Overview of "Pivot Points + Long/Short Position Signals" for Gold, Crude Oil, Forex, and Stock Indices on July 7, 2026

Huitong Finance, July 7th—— Below is the latest "Pivot Point + Long/Short Position Signals" overview for gold, crude oil, forex, and stock indices in the "One Chart" series, including chart interpretation and textual analysis. By comparing the latest net long % with the previous net long % (the net long % of the previous trading day), a total of 13 types of position signals can be interpreted, covering expanding net long, decreasing net long, unchanged net short, net short turning to balanced, etc. Depending on the actual data, several of these signals are displayed accordingly.
One Chart: Overview of "Pivot Point + Long/Short Position Signals" for gold, crude oil, forex, and stock indices on July 7, 2026. The latest data released today (Tuesday, July 7, 2026) show that, as of just now, 6 varieties in this chart are in an "overbought" status (longs over 80%), and 7 varieties are in an "oversold" status (longs less than 20%). Among them, the highest proportion of long positions belongs to spot gold XAU/USD. The proportion of long positions in spot gold XAU/USD is 92%, in US crude oil WTI OIL is 83%, and in EUR/USD is 49%. For more detailed change signals and full lists for these instruments compared to the previous update, please refer to the special chart made by Huitong Finance.
Among the changes in positions, there are 7 varieties with expanding net long, 5 with decreasing net long, 6 with expanding net short, and 1 with decreasing net short. Varieties with long positions reaching or exceeding 80% include: Spot gold XAU/USD with longs at 92%, US crude oil WTI OIL with longs at 83%, FTSE China A50 with longs at 91%, S&P 500 Index with longs at 83%, Dow Jones Index US30 with shorts at 88%, Germany DAX40 GERMANY 40 with shorts at 86%, EUR/JPY with shorts at 88%, GBP/USD with shorts at 83%, GBP/JPY with shorts at 84%, USD/JPY with shorts at 91%, USD/CAD with shorts at 85%, USD/CHF with longs at 83%, NZD/USD with longs at 88%.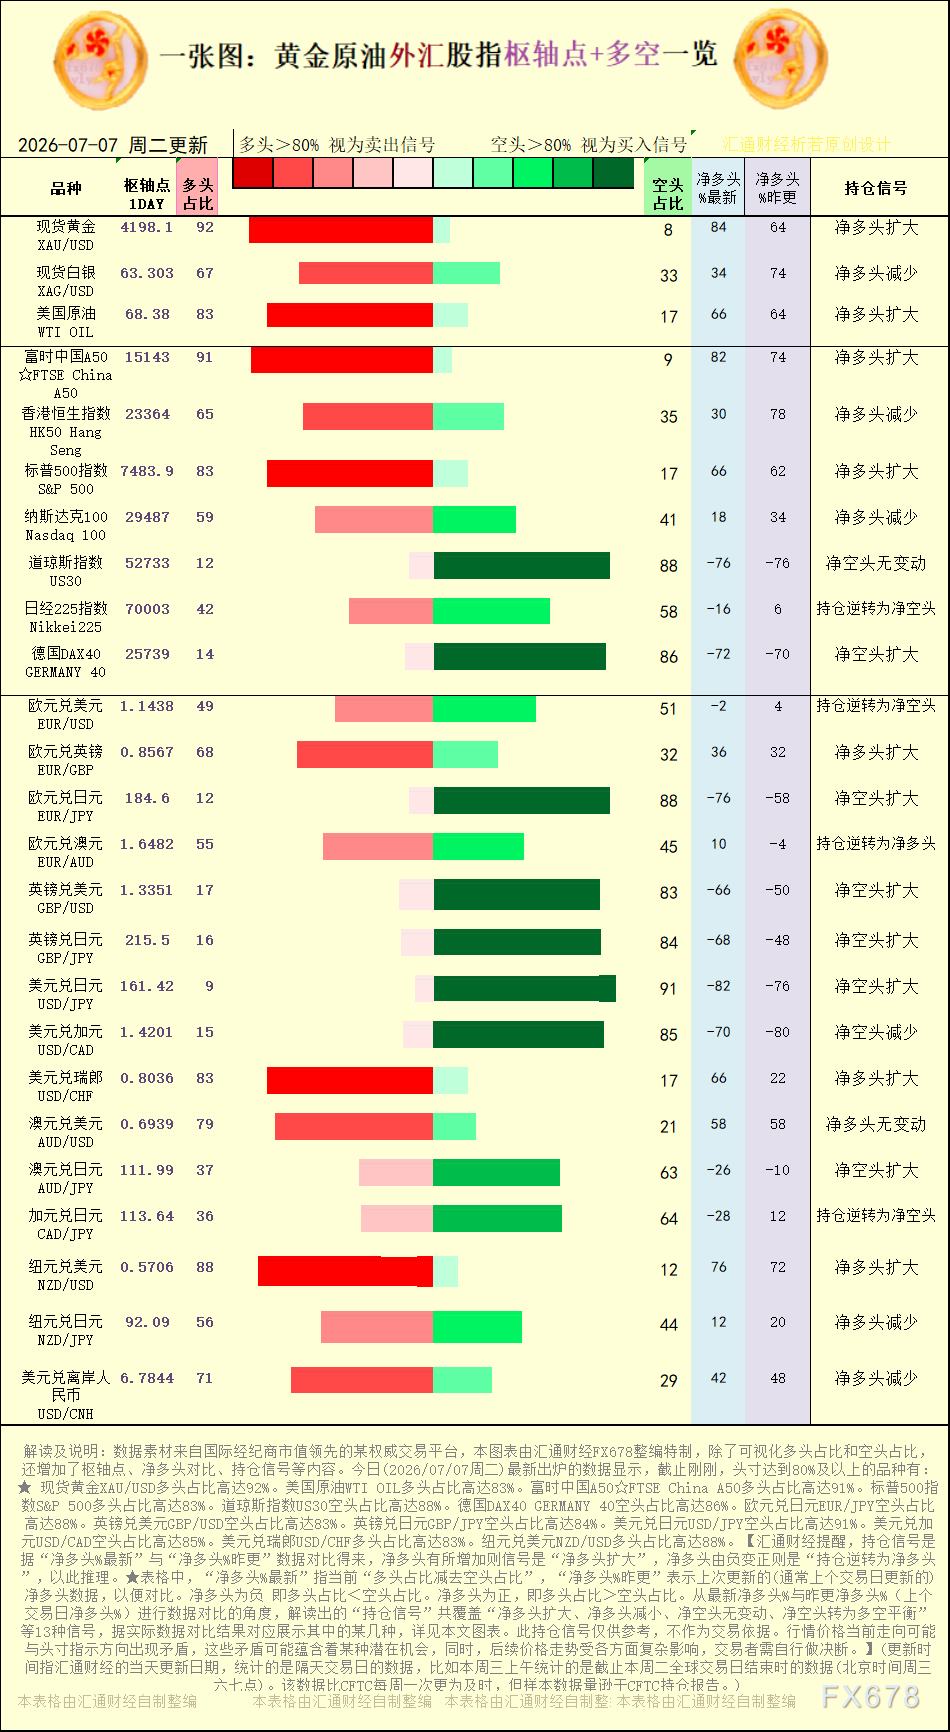
[Chart: Pivot Points and Long/Short Position Signal Analysis for Gold, Crude Oil, Forex, and Stock Indices, Source: Special Chart by Huitong Finance. (Click the image to enlarge)]
Decreasing net short is seen in: USD/CAD.
Expanding net long is seen in: spot gold XAU/USD, US crude oil WTI OIL, FTSE China A50, S&P 500 Index, EUR/GBP, USD/CHF, and NZD/USD. Decreasing net long is seen in: spot silver XAG/USD, HK50 Hang Seng, Nasdaq 100, NZD/JPY, USD/CNH.
Huitong Finance reminds that position signals are derived from comparing the "latest net long %" and the "previous net long %" data. If the net long increases, the signal is "expanding net long"; if net long turns from negative to positive, the signal is "reversal to net long", and so on. In the table, "latest net long %" means the current "long position percentage minus short position percentage", and "previous net long %" means the last (usually previous trading day's) net long data for comparison. Negative net long means long position % short position %. By comparing the latest net long % and the previous net long % (the previous trading day's net long %), a total of 13 varieties of "position signals" can be interpreted, including expanding net long, decreasing net long, unchanged net short, net short turning to balanced, and several of them are displayed in the chart according to the actual data. Current market price trends may appear inconsistent with position indications, which may contain potential opportunities. Meanwhile, subsequent price movements are affected by complex factors, and traders should make their own decisions.
[The instruments involved in this chart include: spot gold, spot silver, US crude oil, FTSE China A50, HK50 Hang Seng, S&P 500 Index, Nasdaq 100, Dow Jones Index, Germany DAX40, EUR/USD, EUR/GBP, EUR/JPY, EUR/AUD, GBP/USD, GBP/JPY, USD/JPY, USD/CAD, USD/CHF, AUD/USD, AUD/JPY, CAD/JPY, NZD/USD.]
Disclaimer: The content of this article solely reflects the author's opinion and does not represent the platform in any capacity. This article is not intended to serve as a reference for making investment decisions.
You may also like
Despite falling oil prices and dovish comments from Fed officials, US Treasury yields continue to rise
The wave of US Treasury sell-offs continues to spread, with the 30-year yield reaching a 24-year high of 5.621% and the 10-year yield rising to its highest level since 2002—oil price declines and dovish signals have both failed, and long-term rates remain unaffected. High yields are reshaping the structure of US equities; as the AI narrative becomes the market’s final pillar, any cracks could trigger a chain reaction of turbulence.
Morgan Stanley trading desk, dubbed the "most accurate in the past two years," turns bullish
The supporting logic encompasses five major pillars: unexpected macro trends, consumer resilience, low profit expectations, stabilized yields, and technical improvements. Since the previous shift on August 31, the Nasdaq 100 long and Russell 2000 short paired trades have accumulated gains of over 8%. This latest "bullish reversal" is even more convincing. Strategically, technology remains the core long position, but the hedging tool has shifted from shorting RTY to derivatives. Meanwhile, the risk of long-term interest rate hikes still persists.

Four major favorable factors emerge, international oil prices respond by falling
Crypto prices
More


