XRP enters the third quarter of 2026 with technical setups highlighting the start of Wave 5. The absence of the CLARITY Act has not stalled price action, with weekly patterns showing that prior corrective phases may have concluded.
Analysts note that market participants are observing for signs of a potential double-digit target, consistent with historical Elliott Wave behavior. Market data indicates that XRP’s support zones have held during recent weekly trading sessions, providing a platform for potential upward momentum.
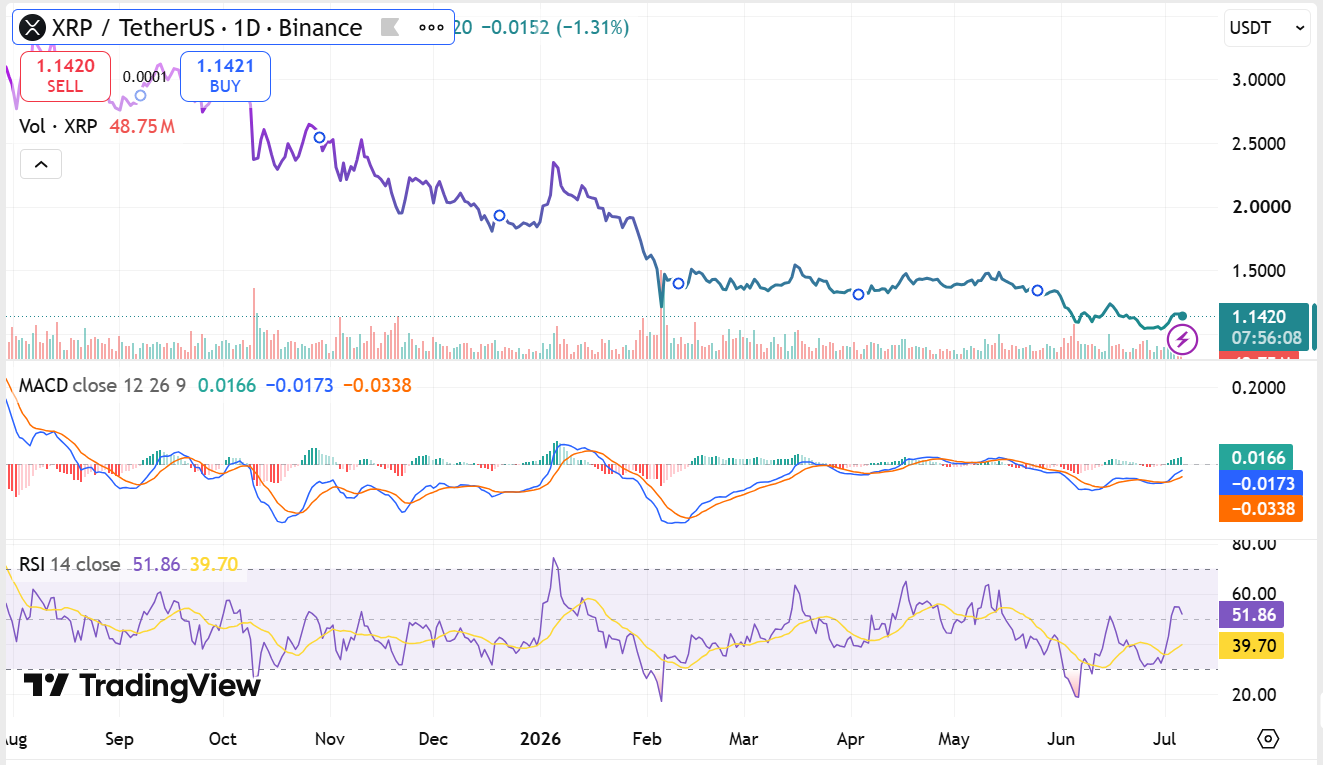
Meanwhile, consolidation near $1.14 appears to be forming a base, while recent volume spikes suggest buyers are gradually re-entering the market. This aligns with the view that the Wave 5 structure is now taking shape, creating a favorable technical backdrop for Q3.
Analyst Charts indicate XRP has respected critical support levels around $1.14–$1.15. The stability at these zones has coincided with a gradual uptick in buying activity, allowing the cryptocurrency to avoid deeper retracements. On the weekly scale, corrections appear to have largely been completed, providing a foundation for potential upward swings.
Moreover, the pattern shows that previous consolidation phases have compressed price action without significant downside penetration. This compression could act as a springboard for bullish movements if buying pressure continues to accumulate in the coming weeks. Traders are watching closely for confirmation of breakout behavior above short-term resistance points.
Even so, momentum indicators, including RSI and MACD, signal the market is no longer in oversold territory. RSI sits near mid-levels, reflecting equilibrium between buyers and sellers. MACD readings show early signs of a bullish crossover on weekly data, reinforcing the narrative that Wave 5 may advance toward higher levels.
 Source:
Historical patterns support this outlook, as prior Wave 5 launches have often coincided with market recoveries following corrective phases. While regulatory clarity remains pending, the technical setup positions XRP for potential gains should buyers continue to accumulate around current support ranges.
The start of Wave 5 without the CLARITY Act suggests that XRP is relying on market momentum rather than external catalysts. On one hand, this may limit dramatic upside in the near term, but on the other hand, it could encourage organic accumulation among traders. Market observers remain attentive to weekly patterns, with a focus on double-digit price targets as a potential milestone in the quarter.
Overall, XRP’s technical structure shows resilience and a measured path for potential upside, supported by consolidation at key support levels and stabilizing momentum indicators. Weekly patterns suggest that the correction phase may have concluded, leaving XRP poised to test higher levels in Q3 2026.