Solana trades at $81.49 on July 7, down 0.49%, pressing directly against the 100-day EMA as the network posts its busiest week on record.
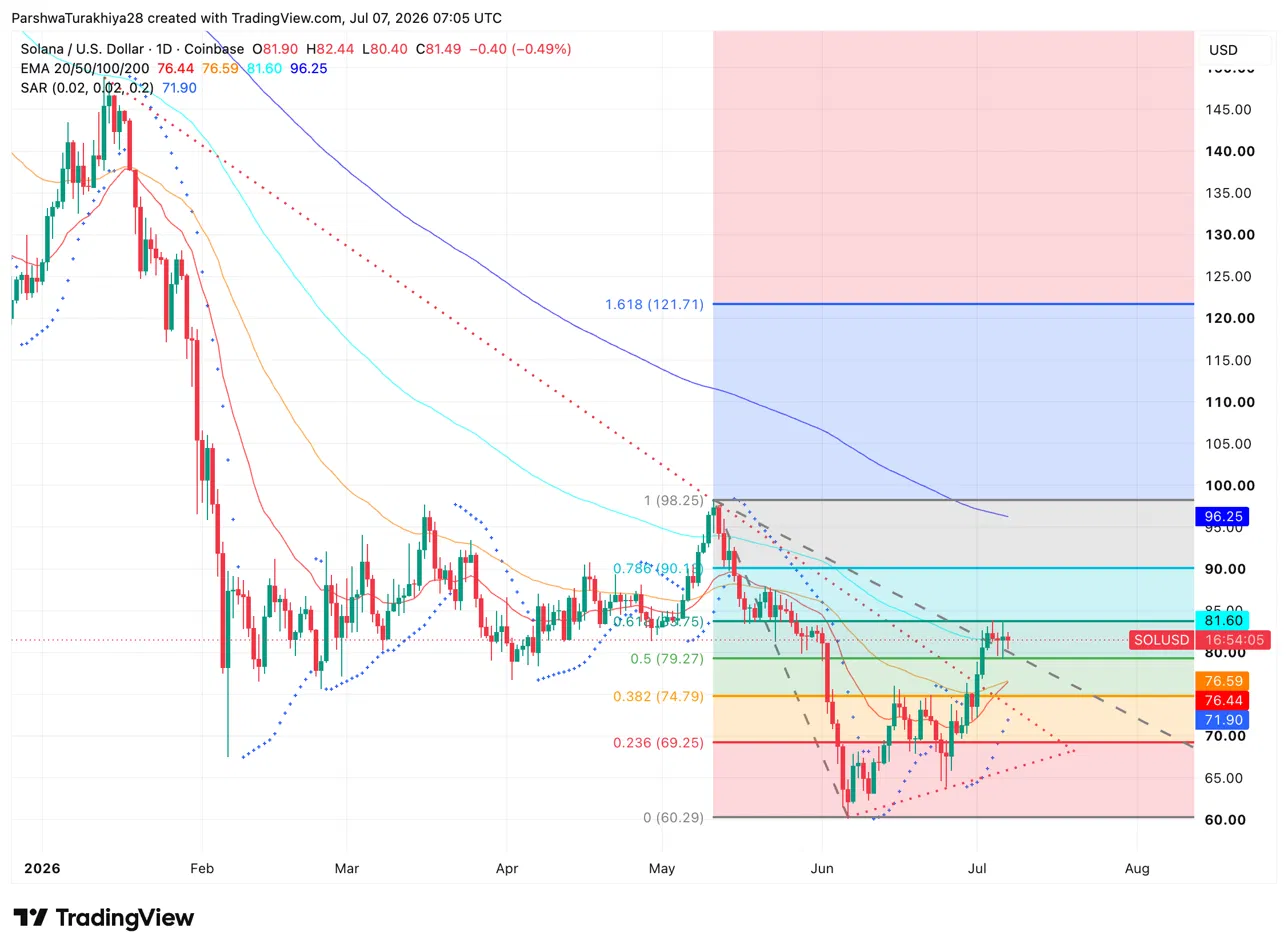 SOL 1D Price Action (Source: TradingView)
The daily chart shows SOL sitting right at the 100-day EMA at $81.60, a level that hasn’t been tested from below since the June breakdown. Price bounced off the $60.29 low and has worked through several Fibonacci retracement levels, clearing the 0.5 level at $79.27 and now pressing against the 0.618 at $83.75 as the next hurdle. The Parabolic SAR at $71.90 sits well below price, confirming the short-term recovery trend remains intact.
The 20-day and 50-day EMAs at $76.44 and $76.59 are now both below spot, having been reclaimed during the July recovery, which is the first time SOL has traded above both simultaneously since May. The 200-day EMA at $96.25 and the 0.786 Fibonacci level at $90.18 mark the heavier resistance zones above.
What Are The Key Support And Resistance Levels For SOL Today?
- Support at $79.27 on the 0.5 Fib and $76.44 on the 20-day EMA
- Resistance at $83.75 on the 0.618 Fib, then $90.18 on the 0.786 Fib
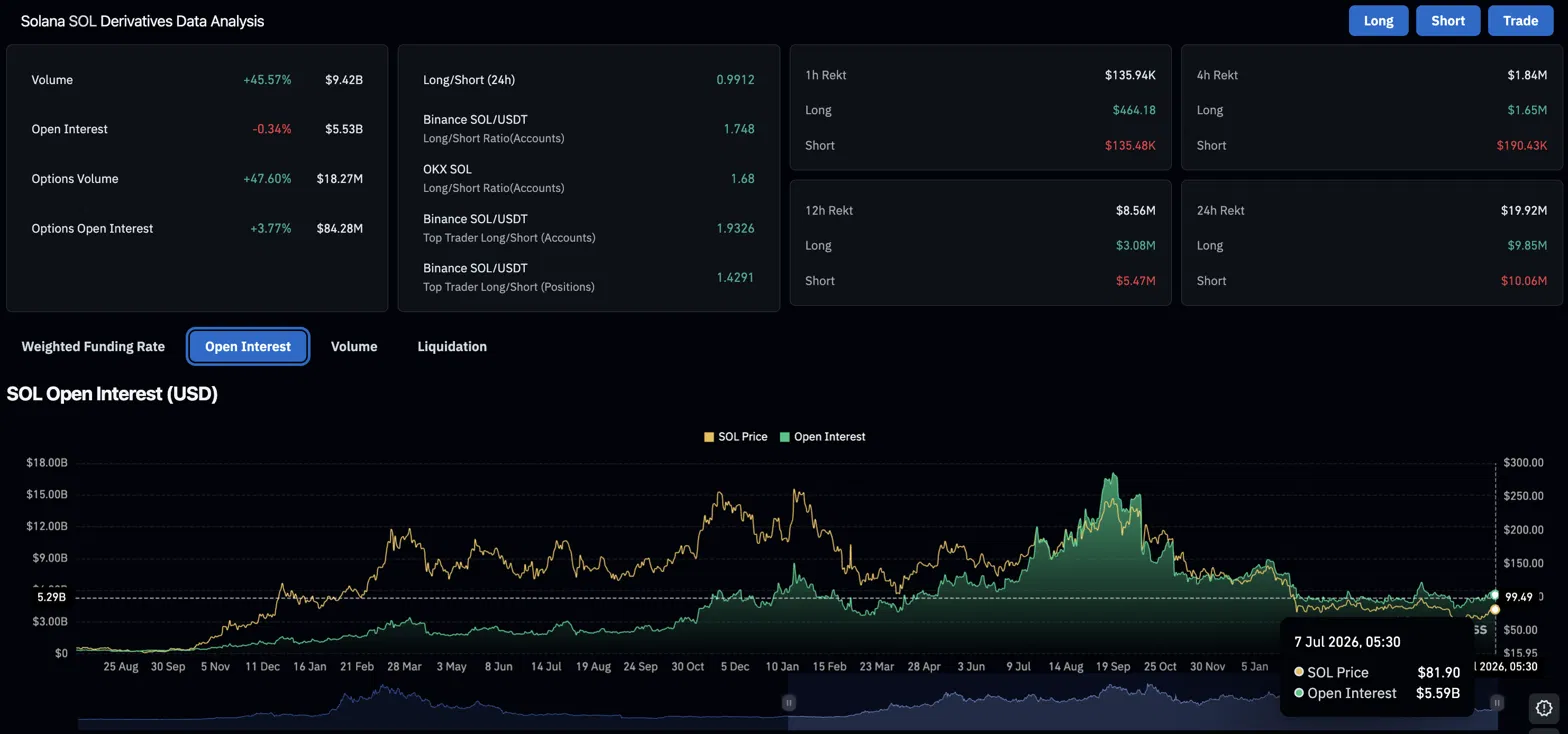 SOL Derivative Analysis (Source: Coinglass)
Volume jumped 45.57% to $9.42B while open interest barely moved, slipping 0.34% to $5.53B. That gap between volume and OI tells you traders are actively repositioning rather than stacking up new leveraged bets. Options volume also spiked 47.60% to $18.27M, meaning a growing number of participants are using options to hedge or take directional views rather than going straight through perpetuals.
The liquidation picture over the past 24 hours is about as balanced as it gets. Shorts lost $10.06M, longs lost $9.85M. Neither side took a real beating, which is actually unusual. It tells you the market is genuinely split on where SOL goes next from the $81 level, and no clear conviction trade has emerged yet.
Solana processed over one billion non-vote transactions in a single week for the first time, according to SolanaFloor. Non-vote transactions are the ones that actually matter for measuring real usage, covering activity from users, applications and traders rather than the background validator voting process. A spike of this size at the start of July points to a sharp pickup in ecosystem activity rather than a gradual trend.
Weekly active users also surged from 16.8 million to 29.7 million in just two weeks, a jump of 12.9 million wallets, or 76.8%, pointing to a sharp acceleration in new participants entering the ecosystem rather than just existing users trading more.
The network also ranked second in global spot crypto trading volume for the second consecutive week, processing $12.25 billion across centralized and decentralized exchanges combined. That figure held above Bybit’s $10.57 billion, with only Binance ahead. Two straight weeks at number two in global volume, combined with a weekly transaction record, positions Solana’s usage narrative well ahead of its price recovery.
July is one of SOL’s better months on the calendar. The average return sits at 24.6% and the median at 17.3%, with five of the past six Julys closing green.
The 2025 reading came in at 11.3%, 2024 added 17.3%, and 2022 surged 26.3%. The 2026 reading is already tracking at 9.93% early in the month, running slightly below the median pace but with most of July still ahead.
- Upside case: SOL holds above the 100-day EMA at $81.60, the transaction record drives continued ecosystem attention, and price targets the 0.786 Fib at $90.18 as the next recovery milestone.
- Downside case: The 100-day EMA rejects price, SOL slips back below the 0.5 Fib at $79.27, and the 20-day EMA cluster near $76.44-$76.59 becomes the next support test.