


Solana is seeing strong on-chain growth after 1.6 million new addresses joined the network in two weeks. At the same time, $SOL is holding its short-term uptrend, keeping the $86-$94 resistance zone in focus if buyers stay in control.
Solana Network Growth Accelerates as 1.6M New Addresses Join
Solana network growth is accelerating, with 1.60 million new addresses joining the network over the past two weeks, according to data shared by Ali Charts.
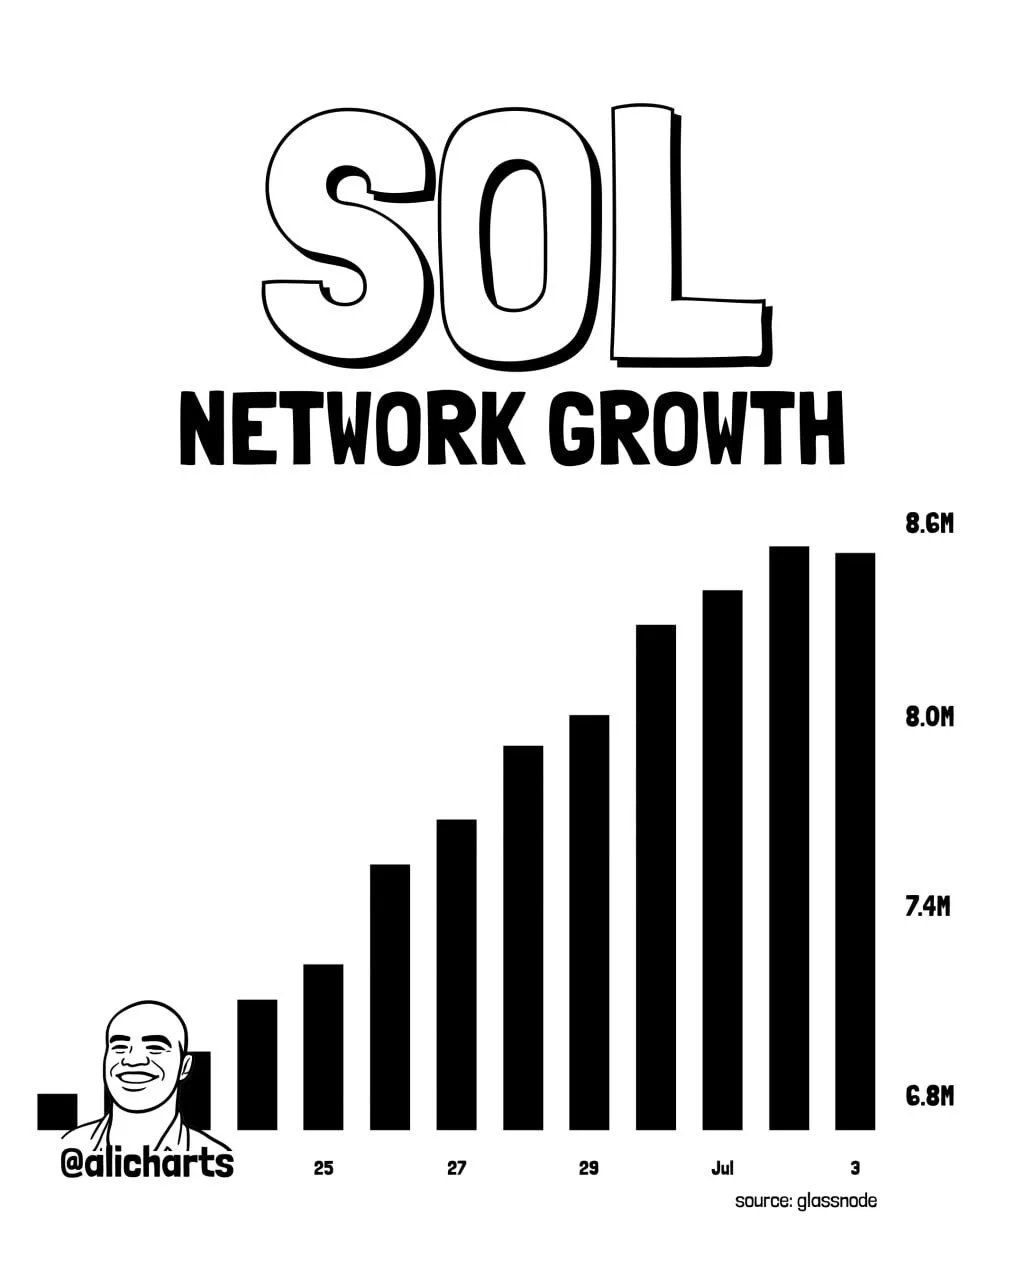
$SOL network growth chart. Source: Ali Charts on X, Glassnode
The chart shows Solana’s total address count rising steadily from late June into early July. Network growth moved from around 6.8 million addresses toward the 8.6 million area during the period shown.
That matters because new addresses can signal rising user interest, stronger network participation and broader activity across the Solana ecosystem.
According to Ali Charts, 1.60 million new addresses joined the Solana network in the past two weeks. That suggests activity is not limited to price action, but is also showing up in on-chain growth.
Strong address growth does not guarantee a price breakout. However, it can support the bullish case when it appears alongside improving market structure, higher usage and stronger demand.
For now, Solana’s network growth is the key signal. If new address activity stays elevated, it could show that more users are entering the ecosystem while traders watch for the next major move in $SOL.
Solana Uptrend Holds as Traders Watch $94 Target
Solana continues to hold its short-term uptrend, with one analyst saying there is still no clear sign that a local top has formed. If the Elliott Wave setup continues, $SOL could next push toward the $86-$94 resistance zone.
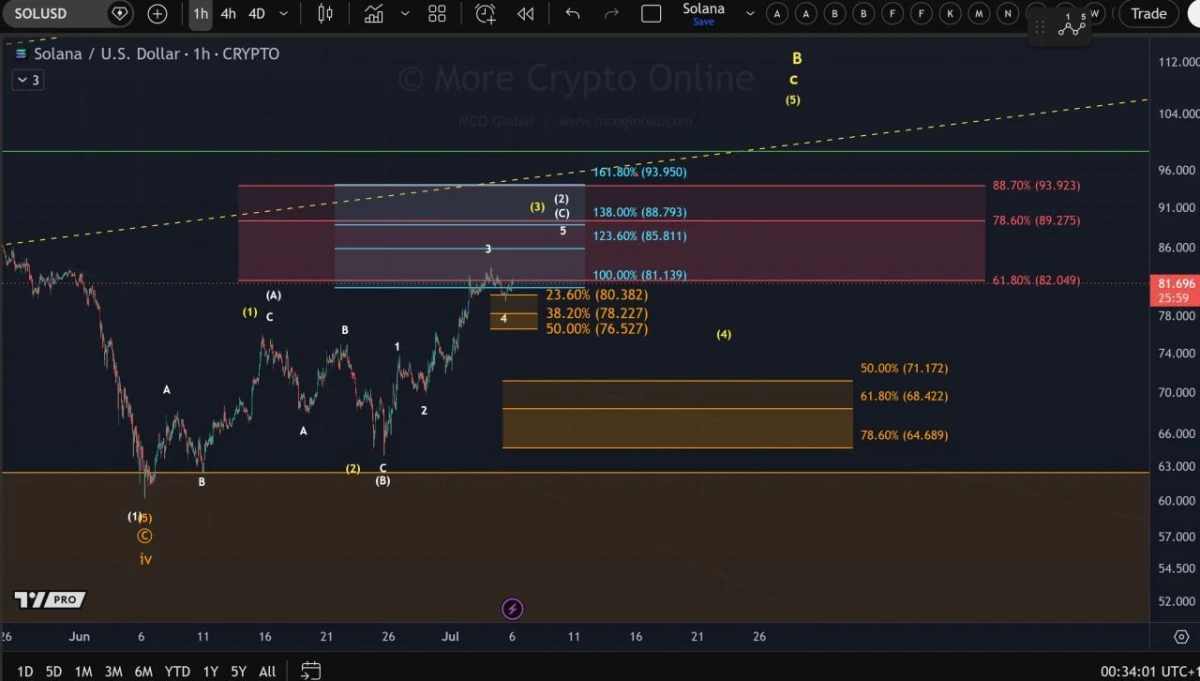
$SOL/USD 1-hour chart. Source: More Crypto Online on X, TradingView
The chart shows $SOL moving higher from its June lows and holding a short-term bullish wave structure.
According to More Crypto Online, the current move still looks constructive because price has not shown clear evidence of a local top.
The first key support area sits near $80.38, followed by $78.22 and $76.52. Holding these levels would keep the short-term uptrend intact.
On the upside, the chart points to possible targets near $85.81, $88.79 and $93.95. Those levels could become the next resistance areas if momentum continues.
A deeper pullback would bring the $71.17-$64.68 zone back into focus. That would weaken the short-term setup but may still fit a larger corrective structure.
For now, the main signal is simple. $SOL needs to hold its higher-low structure to keep the bullish wave count alive.


