
Bitcoin bulls battle for $63K as Micron stock eyes 10% drop in US chip sell-off

Bitcoin (BTC) circled $63,000 after Tuesday’s Wall Street open as chip companies led a dip in US stocks.
Key points:
- Bitcoin attempts to hold $63,000 after seeing its highest levels in two weeks.
- US stock markets see a correction on the day SpaceX joins the Nasdaq-100.
- Bollinger Bands creator John Bollinger continues to eye a long-term BTC price reversal.
BTC price comes off two-week highs as US stocks fall
Data from TradingView showed BTC price action cooling after a trip to $64,660 — its highest point since June 22.
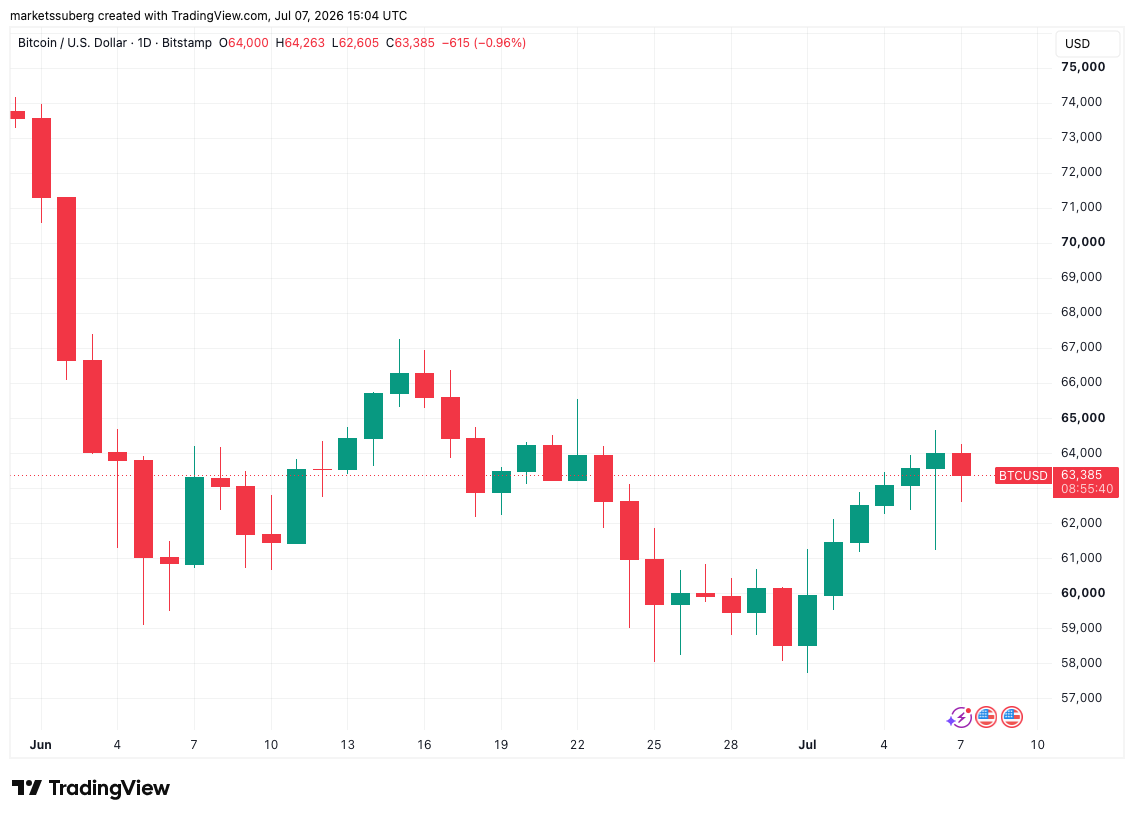
BTC/USD one-day chart. Source: Cointelegraph/TradingView
BTC/USD surfed a comedown in US equities, with the S&P 500 and Nasdaq 100 down 0.6% and 2.1%, respectively, at the time of writing. Chip stocks led the sell-off, with Micron Technologies, whose earnings were highly anticipated last month, down over 9%.
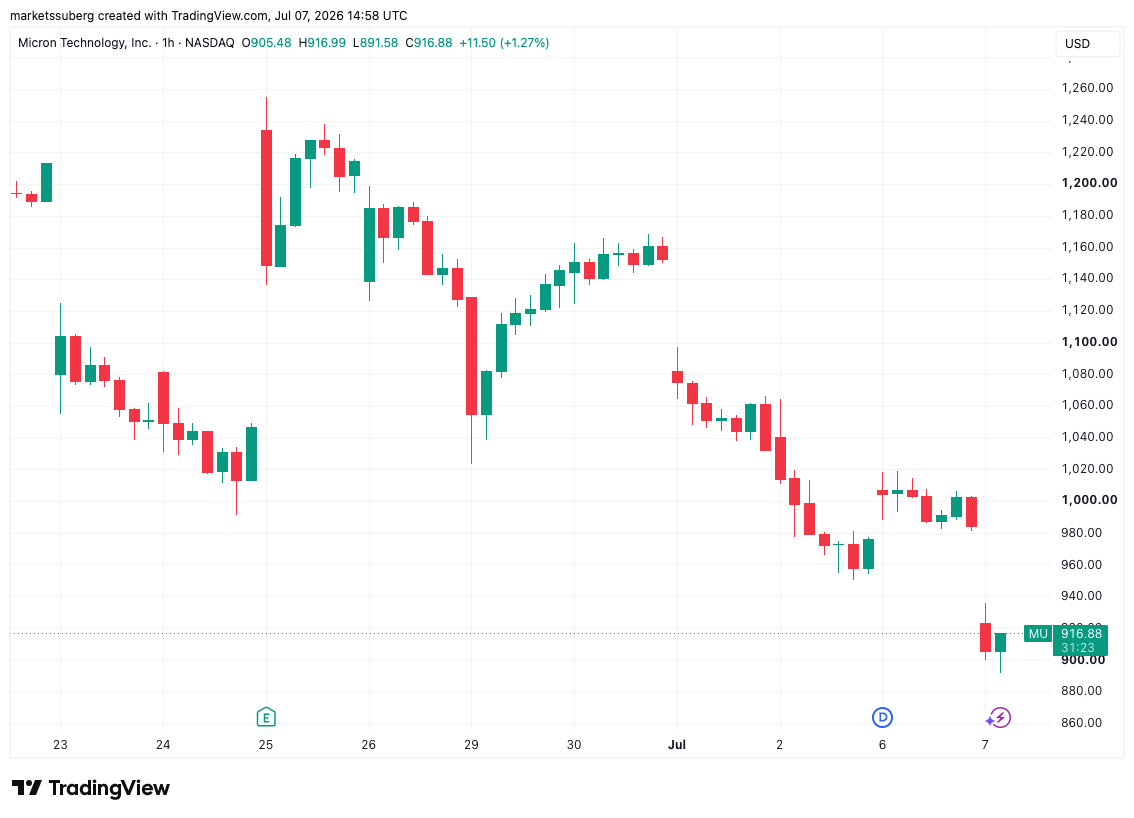
Micron Technologies stock one-hour chart. Source: Cointelegraph/TradingView
At the same time, Tuesday was due to see SpaceX added to the Nasdaq 100 after its own stock turbulence in late June.
“This marks the fastest inclusion into the Nasdaq 100 in the index’s history,” trading resource The Kobeissi Letter noted in its latest commentary on X.
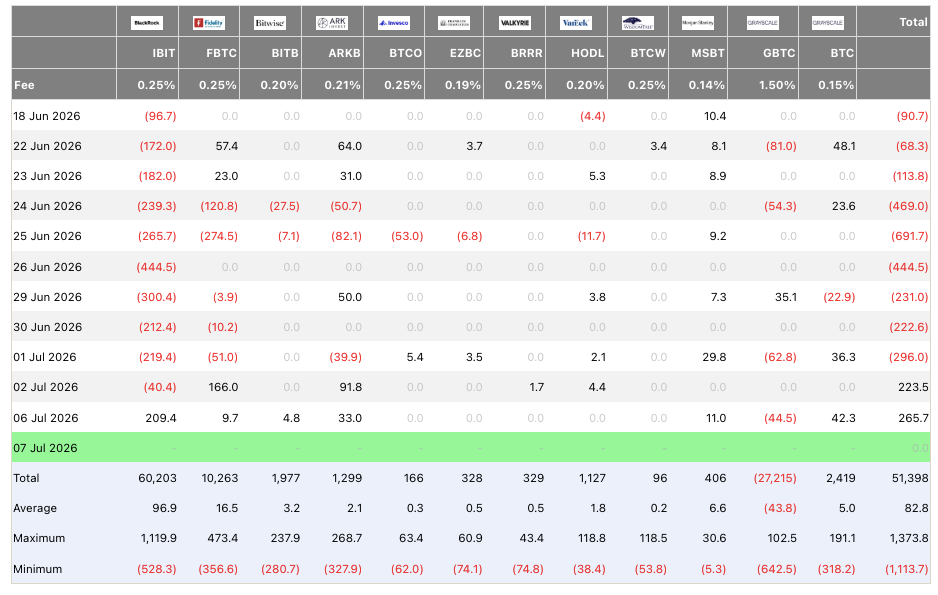
US spot Bitcoin ETF net flows (screenshot). Source: Farside Investors
Fresh from a second day of net inflows to the US spot Bitcoin exchange-traded funds (ETFs), BTC/USD managed to avoid a major comedown.
“Correlation to the Nasdaq just flipped to +0.72 from -0.87 in the matter of days last week,” trader Daan Crypto Trades reported on X.
“That's the difference between trading like a complete hedge/inverse and trading like a high beta tech stock. Right now we're back to the middle on the 4H timeframe.”
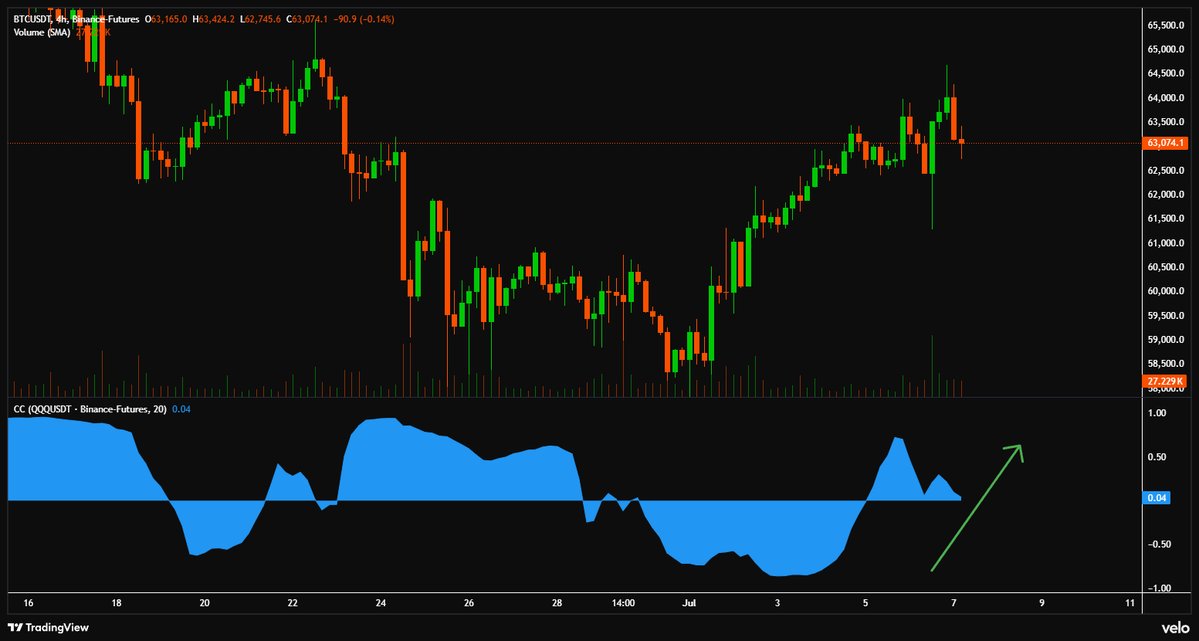
BTC/USDT futures (Binance) four-hour chart. Source: Daan Crypto Trades/X
Commentator Exitpump was conservative on low time frames, expecting a “rounding topping structure” and further downside next.
“The next correction on S&P should mark the true $BTC bottom according to history,” trader Killa suggested on X.
“Lets see if we repeat, 2015, 2018 & 2022.”
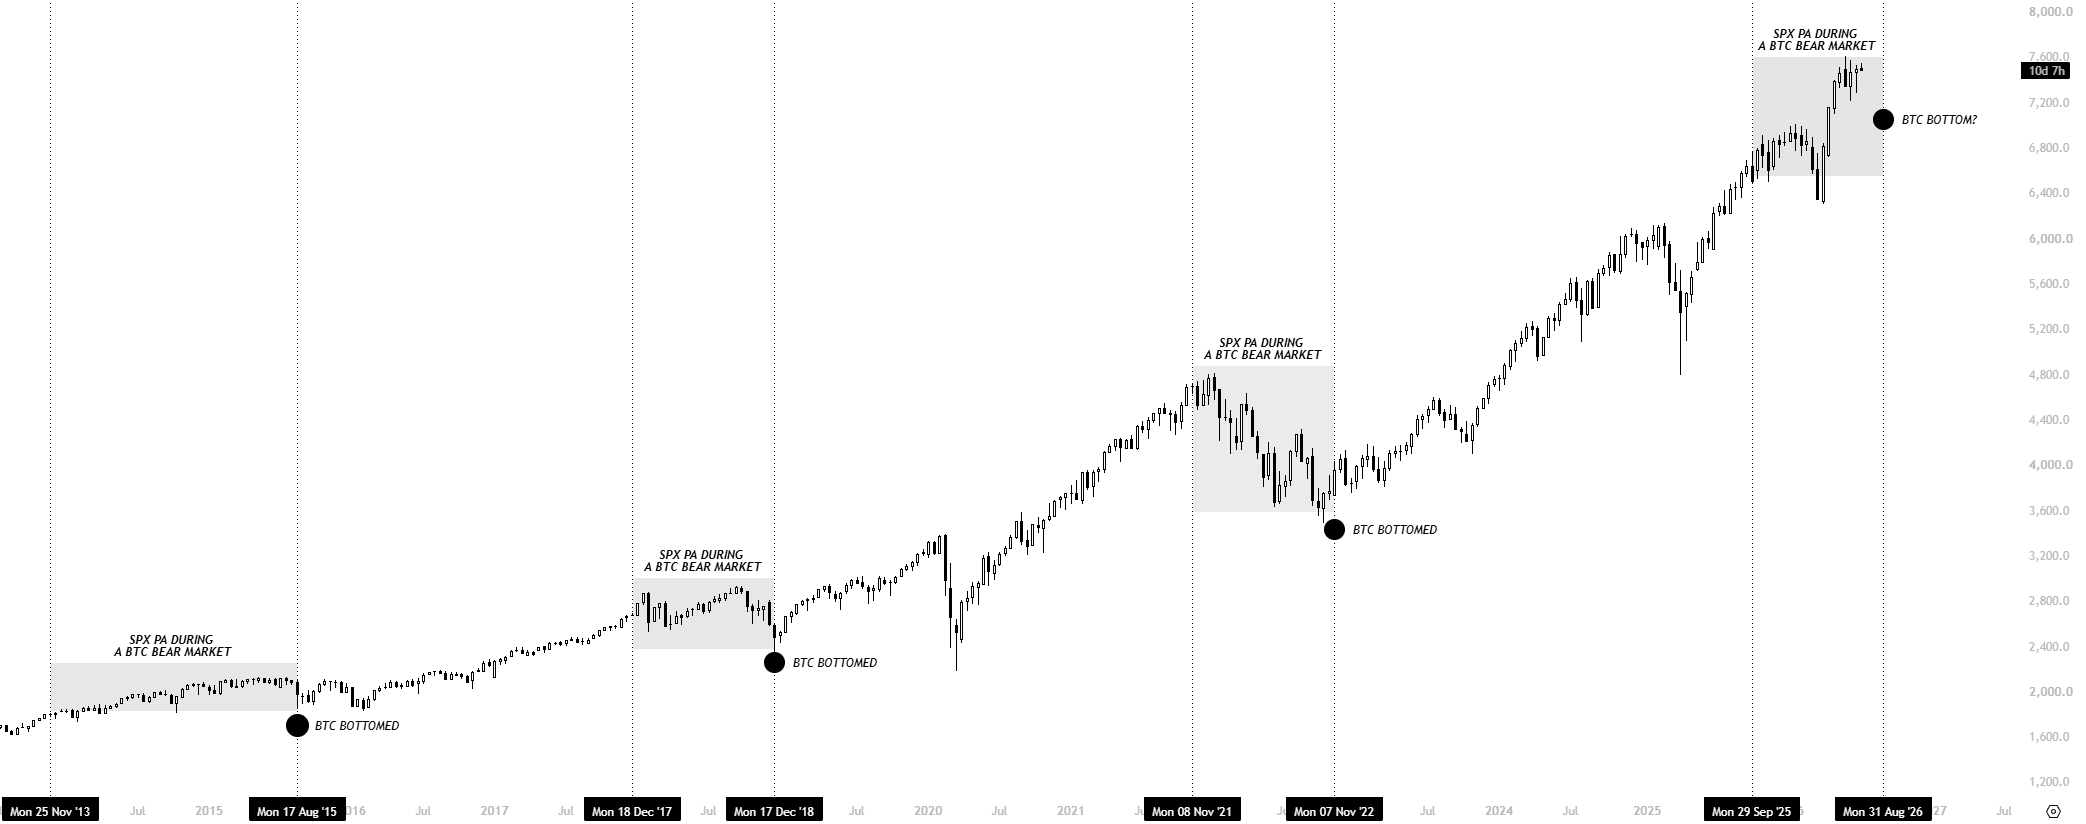
S&P 500 chart data. Source: Killa/X
Bollinger: "We are at a critical point"
In recent X discussions, meanwhile, John Bollinger, creator of the Bollinger Bands volatility indicator, had some more positive news for Bitcoin bulls.
Related: Bitcoin can fall below $58K if one of its 'cleanest' metrics copies history: Analysis
As Cointelegraph reported, Bollinger was eyeing a “W”-shaped reversal pattern currently in the process of confirmation on daily time frames.
Last week, he queried whether its latest iteration could end up canceling the BTC price downtrend altogether.
“We are at a critical point,” he added on Monday.
“In a bear market bullish setups break and in a bull market bearish setups break. So if this W pattern is successful I would see it as a confirmation of a change in trend.”
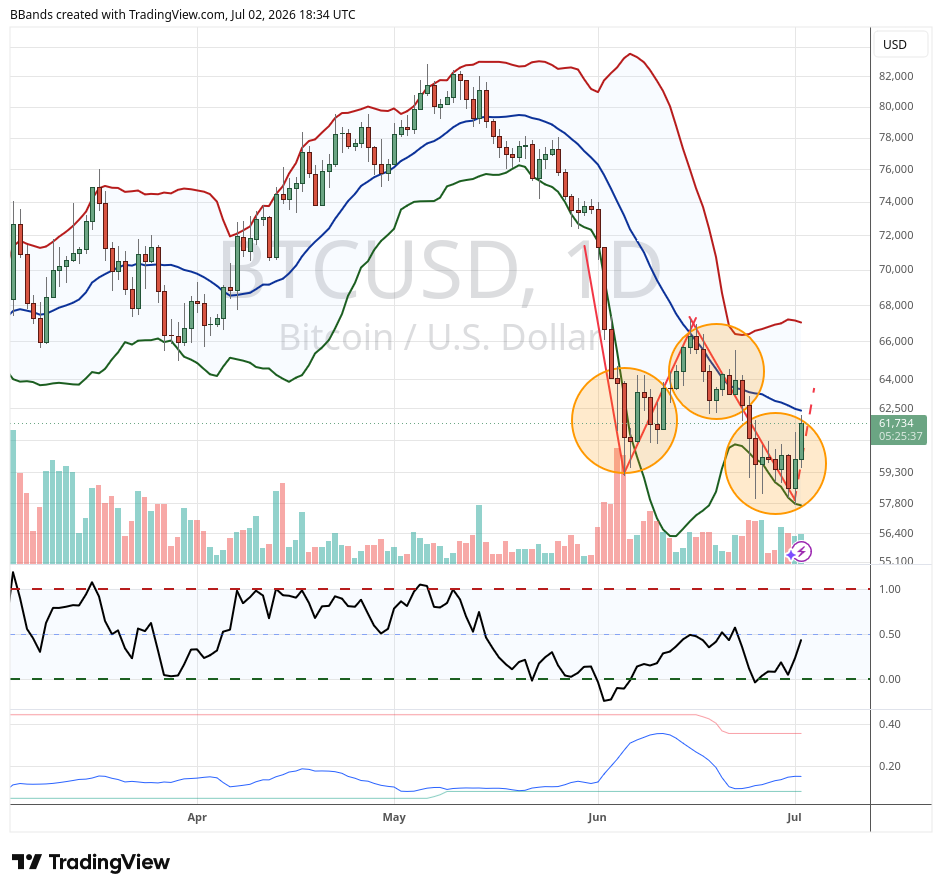
BTC/USD one-day chart with Bollinger Bands. Source: John Bollinger/X
Disclaimer: The content of this article solely reflects the author's opinion and does not represent the platform in any capacity. This article is not intended to serve as a reference for making investment decisions.
You may also like
VVV crypto falls 25% – Could Venice Token’s buy zone be near $20?
As the FSD experience leaps forward and Optimus rushes toward mass production, a $30 billion standby credit facility offers strong support! Tesla (TSLA.US) accelerates Elon Musk's "physical AI master plan"
Tesla has secured $30 billion in new loans and credit lines as the electric vehicle manufacturer is ramping up its investments in artificial intelligence and robotics technology.
Gold price tests trend support as U.S. Treasury yields pull back
30-year US Treasury yield hits highest level since 2002, sell-off may continue under seasonal pressure
On Tuesday, the US 30-year Treasury yield rose to 5.62%, reaching its highest level since 2002, while the 10-year yield briefly touched 5.29%. High oil prices intensifying inflation expectations, robust economic data supporting rate hike expectations, concerns about fiscal sustainability, and a surge in corporate bond supply have collectively driven this round of sell-off. Historical seasonality indicates that September and October are typically the weakest months for US Treasuries, and volatility risk remains high going forward.
Crypto prices
More


