
A Visual Overview of Commodity Support and Resistance: Gold, Silver, Oil, Gas + Platinum, Palladium, Copper, Agricultural Futures (July 22, 2026)

Huitong Finance July 22—— A chart shows commodity support and resistance: Gold, Silver, Oil & Gas + Platinum, Palladium, Copper + Agricultural Futures. Updated at 07:15 on Wednesday, July 22, 2026, covering 14 varieties including gold, silver, platinum, palladium, copper, crude oil, natural gas, fuel oil, wheat, corn, cotton, etc. For more details, refer to the customized chart provided by Huitong Finance's Analysis Department.
A chart shows commodity support and resistance: Gold, Silver, Oil & Gas + Platinum, Palladium, Copper + Agricultural Futures. Updated at 07:15 on Wednesday, July 22, 2026 (UTC+8), covering 14 varieties including gold, silver, platinum, palladium, copper, crude oil, natural gas, fuel oil, wheat, corn, cotton, etc. For more details, refer to the customized chart provided by Huitong Finance's Analysis Department.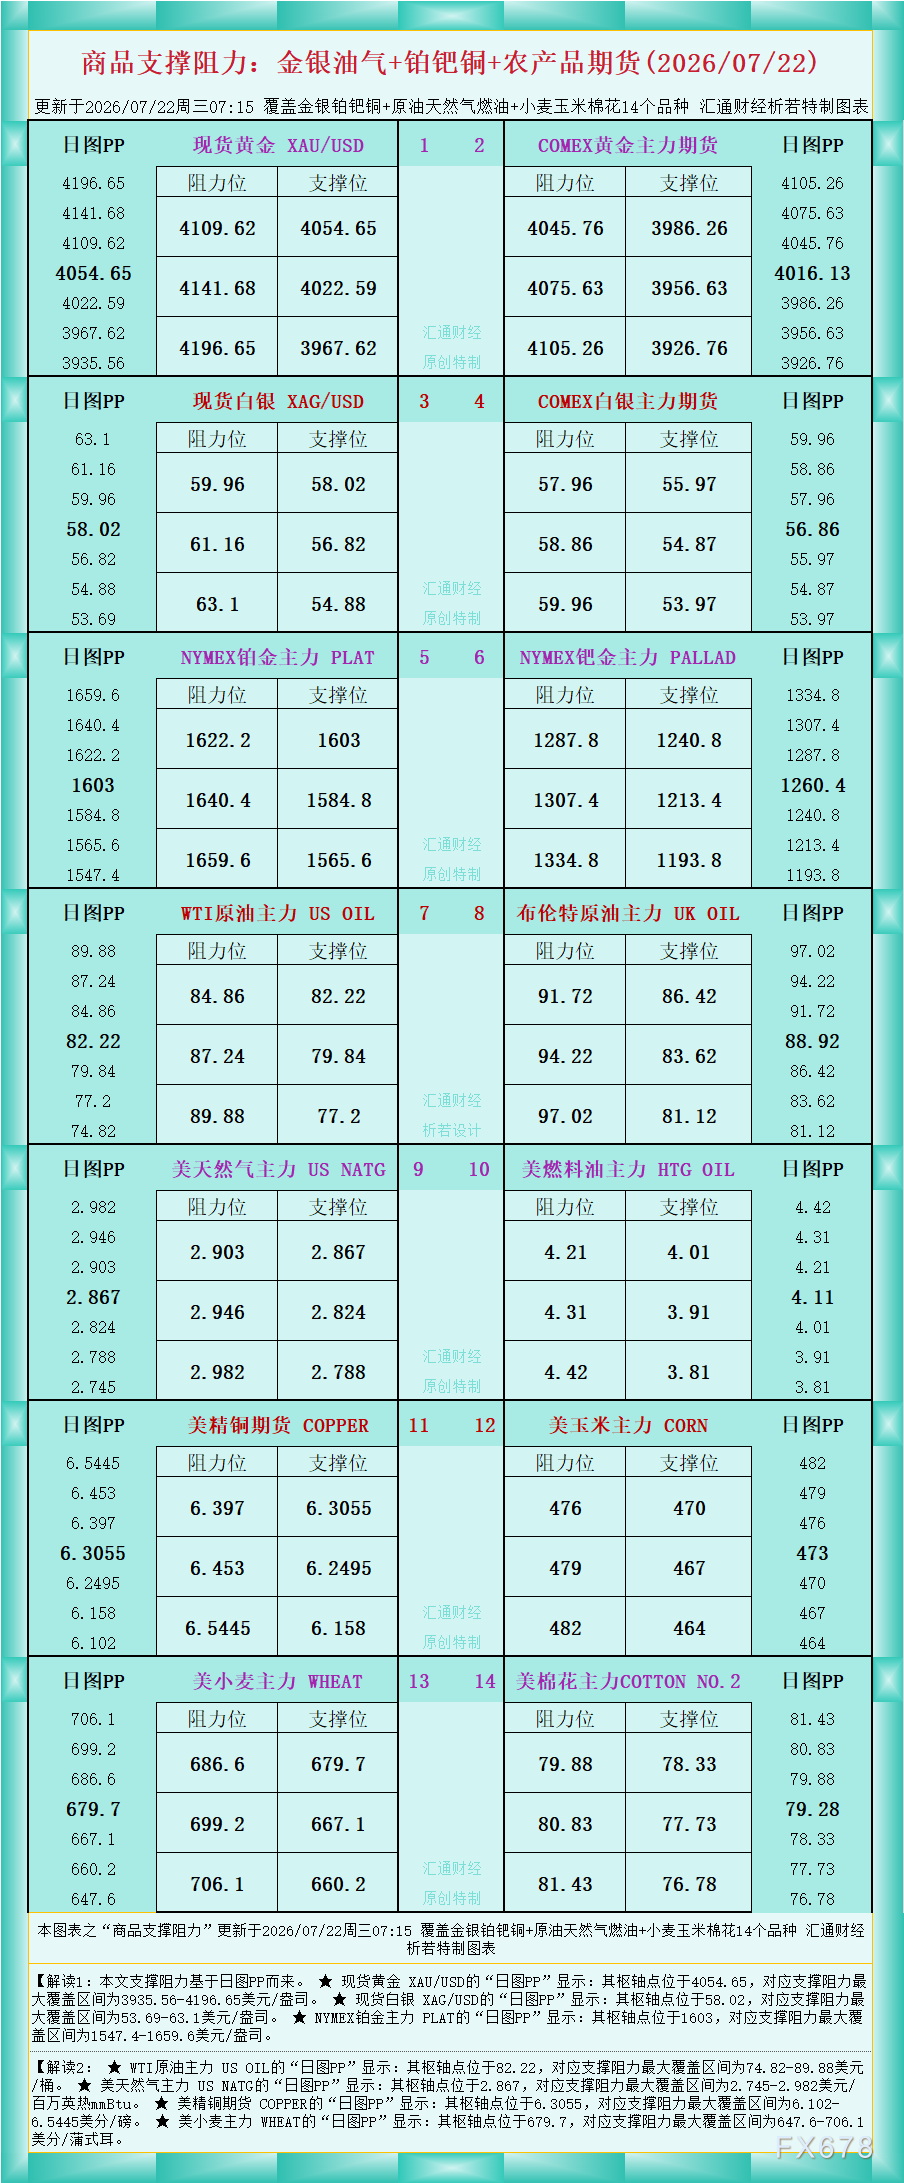
As shown in the chart, Interpretation 1: The support and resistance values in this article are based on daily chart PP.
★ For spot gold XAU/USD, the “Daily Chart PP” shows: The pivot point is at 4054.65, with the maximum support and resistance range between $3935.56 and $4196.65 per ounce.
★ For spot silver XAG/USD, the “Daily Chart PP” shows: The pivot point is at 58.02, with the maximum support and resistance range between $53.69 and $63.1 per ounce.
★ For NYMEX platinum main contract PLAT, the “Daily Chart PP” shows: The pivot point is at 1603, with the maximum support and resistance range between $1547.4 and $1659.6 per ounce.
Interpretation 2:
★ For WTI crude oil main contract US OIL, the “Daily Chart PP” shows: The pivot point is at 82.22, with the maximum support and resistance range between $74.82 and $89.88 per barrel.
★ For US natural gas main contract US NATG, the “Daily Chart PP” shows: The pivot point is at 2.867, with the maximum support and resistance range between $2.745 and $2.982 per million British thermal units (mmBtu).
★ For US copper futures COPPER, the “Daily Chart PP” shows: The pivot point is at 6.3055, with the maximum support and resistance range between 6.102 and 6.5445 cents per pound.
★ For US wheat main contract WHEAT, the “Daily Chart PP” shows: The pivot point is at 679.7, with the maximum support and resistance range between 647.6 and 706.1 cents per bushel.
For analysis of more varieties, please refer to the chart. Originally customized and copyrighted by Huitong Finance.
Disclaimer: The content of this article solely reflects the author's opinion and does not represent the platform in any capacity. This article is not intended to serve as a reference for making investment decisions.
You may also like
This week’s Non-farm Payrolls and PCE to be released; U.S. economic resilience may further boost rate hike expectations
Key US data this week is expected to further support the likelihood of another rate hike in October.
Pioneer Altcoin ETH Trades Under $2,700 Missing a Weekly Close Above $2,800, Can $3,400 Still Be Reclaimed?
As security concerns heat up, NVIDIA (NVDA.US) introduces engineering responses! Dual-layer AI security platform directly addresses agent permissions and abnormal behaviors.
Nvidia has launched a dual-layer AI security platform called the "Open Agent Safety Platform." Through a three-tier architecture—application layer, runtime, and infrastructure—it provides AI agents with continuous monitoring, real-time policy enforcement, and security governance.
Crypto prices
More


