
A Chart of Commodity Support and Resistance: Gold, Silver, Oil, Gas + Platinum, Palladium, Copper, Agricultural Futures (July 24, 2026)

Huitong Network, July 24 — A visual overview of commodity support and resistance: Gold, Silver, Oil, Gas + Platinum, Palladium, Copper + Agricultural Futures. Updated on Friday, July 24, 2026, 07:25 (UTC+8). Specifically covers 14 instruments including Gold, Silver, Platinum, Palladium, Copper + Crude Oil, Natural Gas, Fuel Oil + Wheat, Corn, Cotton. For more details, refer to the specially curated chart by Huitong Finance Analysis.
A visual overview of commodity support and resistance: Gold, Silver, Oil, Gas + Platinum, Palladium, Copper + Agricultural Futures. Updated on Friday, July 24, 2026, 07:25 (UTC+8). Specifically covers 14 instruments including Gold, Silver, Platinum, Palladium, Copper + Crude Oil, Natural Gas, Fuel Oil + Wheat, Corn, Cotton. For more details, refer to the specially curated chart by Huitong Finance Analysis.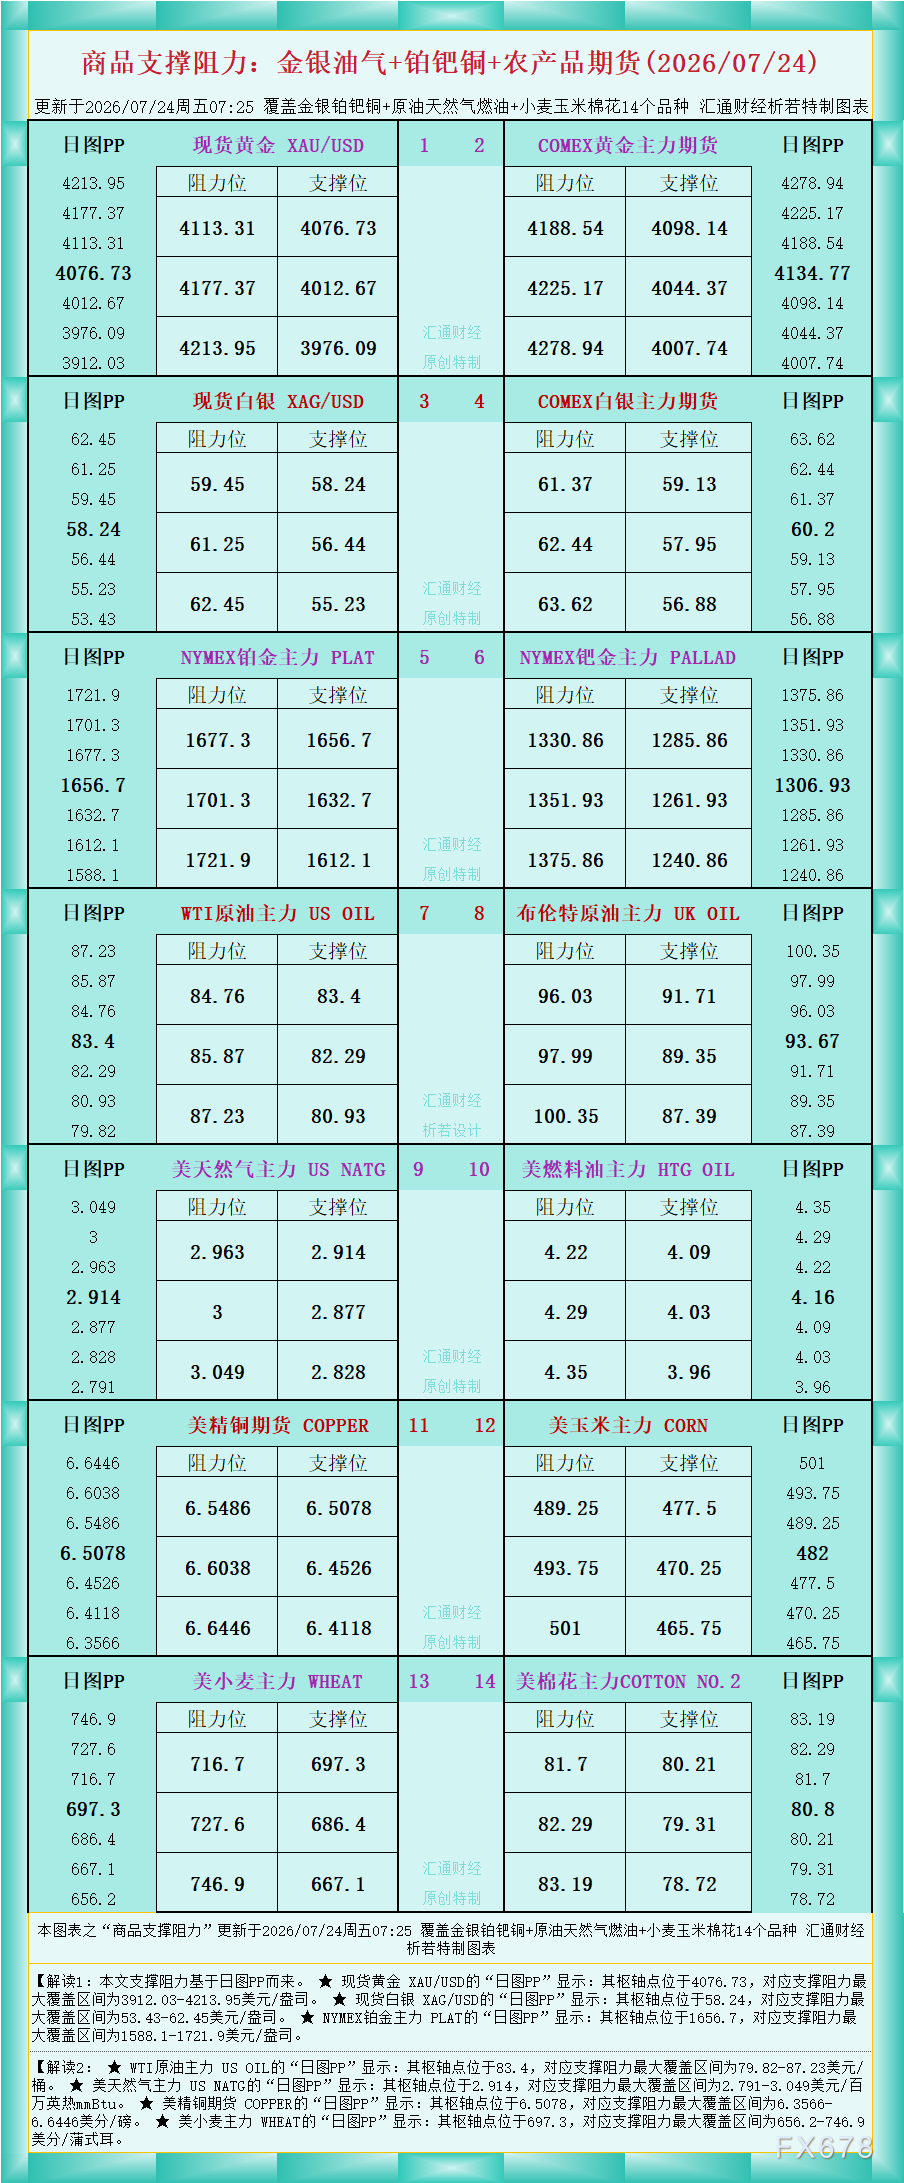
As shown in the chart, Interpretation 1: Support and resistance levels in this article are based on the daily chart PP.
★ Spot Gold XAU/USD “Daily Chart PP” shows: its pivot point is at 4076.73, with the largest support and resistance coverage range from $3912.03 to $4213.95 per ounce.
★ Spot Silver XAG/USD “Daily Chart PP” shows: its pivot point is at 58.24, with the largest support and resistance coverage range from $53.43 to $62.45 per ounce.
★ NYMEX Platinum Main Contract PLAT “Daily Chart PP” shows: its pivot point is at 1656.7, with the largest support and resistance coverage range from $1588.1 to $1721.9 per ounce.
Interpretation 2:
★ WTI Crude Oil Main Contract US OIL “Daily Chart PP” shows: its pivot point is at 83.4, with the largest support and resistance coverage range from $79.82 to $87.23 per barrel.
★ US Natural Gas Main Contract US NATG “Daily Chart PP” shows: its pivot point is at 2.914, with the largest support and resistance coverage range from $2.791 to $3.049 per million British thermal units (mmBtu).
★ US Copper Futures COPPER “Daily Chart PP” shows: its pivot point is at 6.5078, with the largest support and resistance coverage range from 6.3566 to 6.6446 cents/pound.
★ US Wheat Main Contract WHEAT “Daily Chart PP” shows: its pivot point is at 697.3, with the largest support and resistance coverage range from 656.2 to 746.9 cents/bushel.
For more interpretive details of other instruments, please refer to the chart.
Disclaimer: The content of this article solely reflects the author's opinion and does not represent the platform in any capacity. This article is not intended to serve as a reference for making investment decisions.
You may also like
Hyperliquid’s big test: Can institutional demand absorb $100M in whale selling?
Gold falls below $4,200: Triple pressures rise, bears eye $4,000 or even $3,800
Trump Rejects Iran's Proposal for Talks; Global Stocks and Bonds Under Pressure, Oil Prices Up Over 2%, Gold Falls Below 4200
Trump rejected Iran's latest proposal to reopen the Strait of Hormuz, causing the optimistic sentiment in the market last Friday to quickly reverse amidst the Middle East diplomatic stalemate. Brent crude oil rose over 2%, gold fell below $4,200, and silver dropped more than 4%. Asia-Pacific stock markets broadly declined, with South Korea's KOSPI falling over 2%. Global bond markets came under pressure, and the yield on the US 2-year Treasury rose to 4.90%. Market focus will shift to this week's PCE inflation data and the non-farm payroll report.
Indian Rupee starts the week negatively amid higher oil prices
Crypto prices
More


