
A Chart Overview of Commodity Support and Resistance: Gold, Silver, Oil, Gas + Platinum, Palladium, Copper, and Agricultural Futures (July 29, 2026)

Huixun Finance July 29 News—— One Chart Shows Commodity Support and Resistance: Gold, Silver, Oil & Gas + Platinum, Palladium, Copper + Agricultural Futures, updated at 07:25 on Wednesday, July 29, 2026 (UTC+8). Specifically covers 14 products including Gold, Silver, Platinum, Palladium, Copper + Crude Oil, Natural Gas, Fuel Oil + Wheat, Corn, and Cotton. For more, please refer to the exclusive charts by Huixun Finance Analyst.
One Chart Shows Commodity Support and Resistance: Gold, Silver, Oil & Gas + Platinum, Palladium, Copper + Agricultural Futures, updated at 07:25 on Wednesday, July 29, 2026 (UTC+8). Specifically covers 14 varieties including Gold, Silver, Platinum, Palladium, Copper + Crude Oil, Natural Gas, Fuel Oil + Wheat, Corn, Cotton. For more, please refer to the exclusive charts by Huixun Finance Analyst.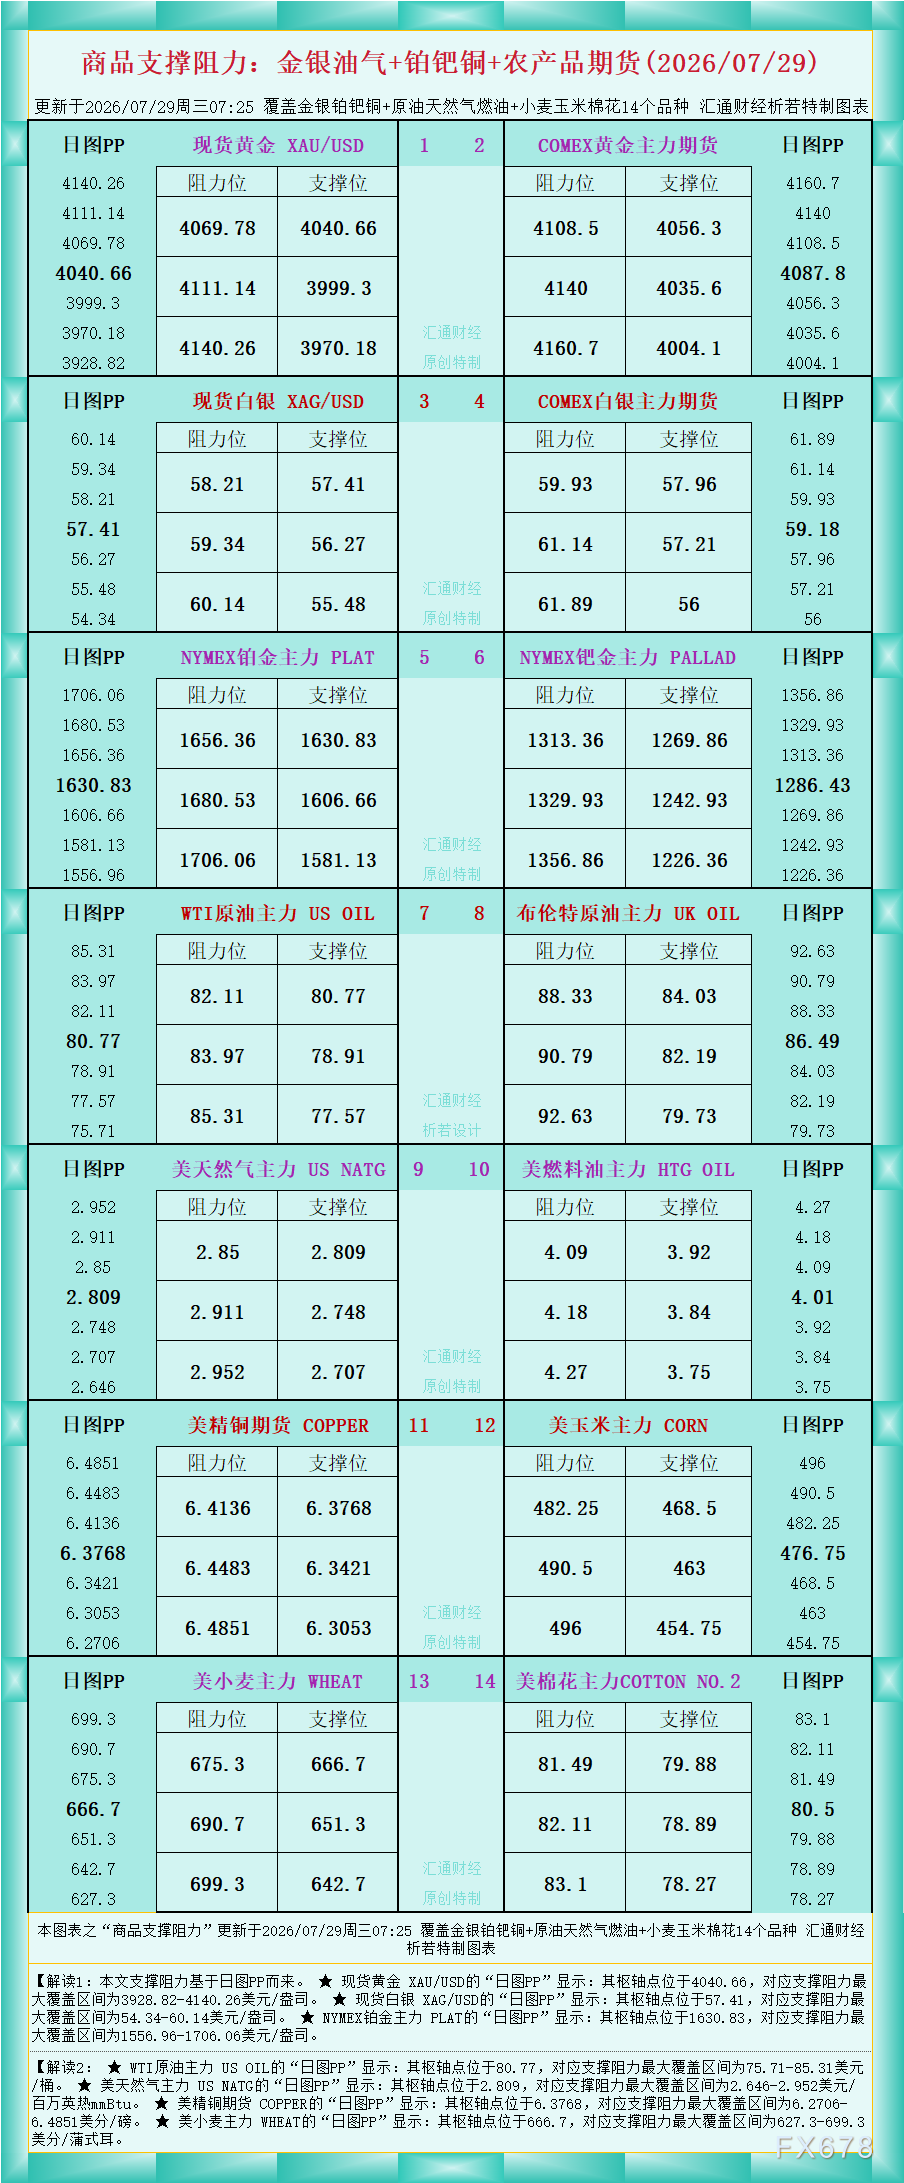
As shown in the chart, Interpretation 1: The support and resistance in this article are based on the daily PP chart.
★ Daily PP for spot Gold XAU/USD indicates: the pivot point is at 4040.66, with the maximum support and resistance range covering 3928.82-4140.26 USD/oz.
★ Daily PP for spot Silver XAG/USD indicates: the pivot point is at 57.41, with the maximum support and resistance range covering 54.34-60.14 USD/oz.
★ Daily PP for NYMEX Platinum Main Contract PLAT indicates: the pivot point is at 1630.83, with the maximum support and resistance range covering 1556.96-1706.06 USD/oz.
Interpretation 2:
★ Daily PP for WTI Crude Oil Main Contract US OIL indicates: the pivot point is at 80.77, with the maximum support and resistance range covering 75.71-85.31 USD/barrel.
★ Daily PP for US Natural Gas Main Contract US NATG indicates: the pivot point is at 2.809, with the maximum support and resistance range covering 2.646-2.952 USD/MMBtu.
★ Daily PP for US Copper Futures COPPER indicates: the pivot point is at 6.3768, with the maximum support and resistance range covering 6.2706-6.4851 cents/pound.
★ Daily PP for US Wheat Main Contract WHEAT indicates: the pivot point is at 666.7, with the maximum support and resistance range covering 627.3-699.3 cents/bushel.
For more variety insights, refer to the chart.
Disclaimer: The content of this article solely reflects the author's opinion and does not represent the platform in any capacity. This article is not intended to serve as a reference for making investment decisions.
You may also like
Slowing AI models may not necessarily be bearish: three structural tailwinds for traditional data centers outweigh rising interest rates
HSBC believes that the traditional growth logic of data centers is shifting from frontier model iteration to AI commercialization and diffusion. With the rise in inference demand and increased capital expenditure from cloud service providers, combined with tightening power and regulatory constraints, the supply-demand imbalance is expected to persist until 2028. Even with rising interest rates, the compound annual growth rate of AFFO per share is still expected to reach 11%–12% from 2025 to 2028, demonstrating strong earning resilience.
This time, will U.S. Treasury bonds crash U.S. stocks?
Bloomberg strategist Simon White warns that the recent rise in US Treasury yields is shifting from a "benign" increase driven by interest rate expectations to a disorderly surge fueled by expanding term premium. Market analysts note that higher long-term interest rates will simultaneously push up US stock valuation discount rates and corporate financing costs, intensifying liquidation pressure on highly leveraged assets. If interest rates above 5% become the new norm, US stock valuations will face ongoing compression pressure.
Eurosystem Launches Blockchain Platform for Tokenized Asset Settlements
Crypto prices
More


