
A Chart of Commodity Support and Resistance: Gold, Silver, Oil, Gas + Platinum, Palladium, Copper, Agricultural Futures (July 30, 2026)

Fxstreet.com July 30th News—— One chart to view commodity support and resistance: gold, silver, oil, gas + platinum, palladium, copper + agricultural futures, updated at 07:25, Thursday, July 30th, 2026 (UTC+8). Specifically covers 14 products including gold, silver, platinum, palladium, copper + crude oil, natural gas, diesel oil + wheat, corn, cotton. For more details, please refer to the exclusive chart made by Fxstreet Analysis.
One chart to view commodity support and resistance: gold, silver, oil, gas + platinum, palladium, copper + agricultural futures, updated at 07:25, Thursday, July 30th, 2026 (UTC+8). Specifically covers 14 products including gold, silver, platinum, palladium, copper + crude oil, natural gas, diesel oil + wheat, corn, cotton. For more details, see the content in Fxstreet Finance's exclusive custom chart.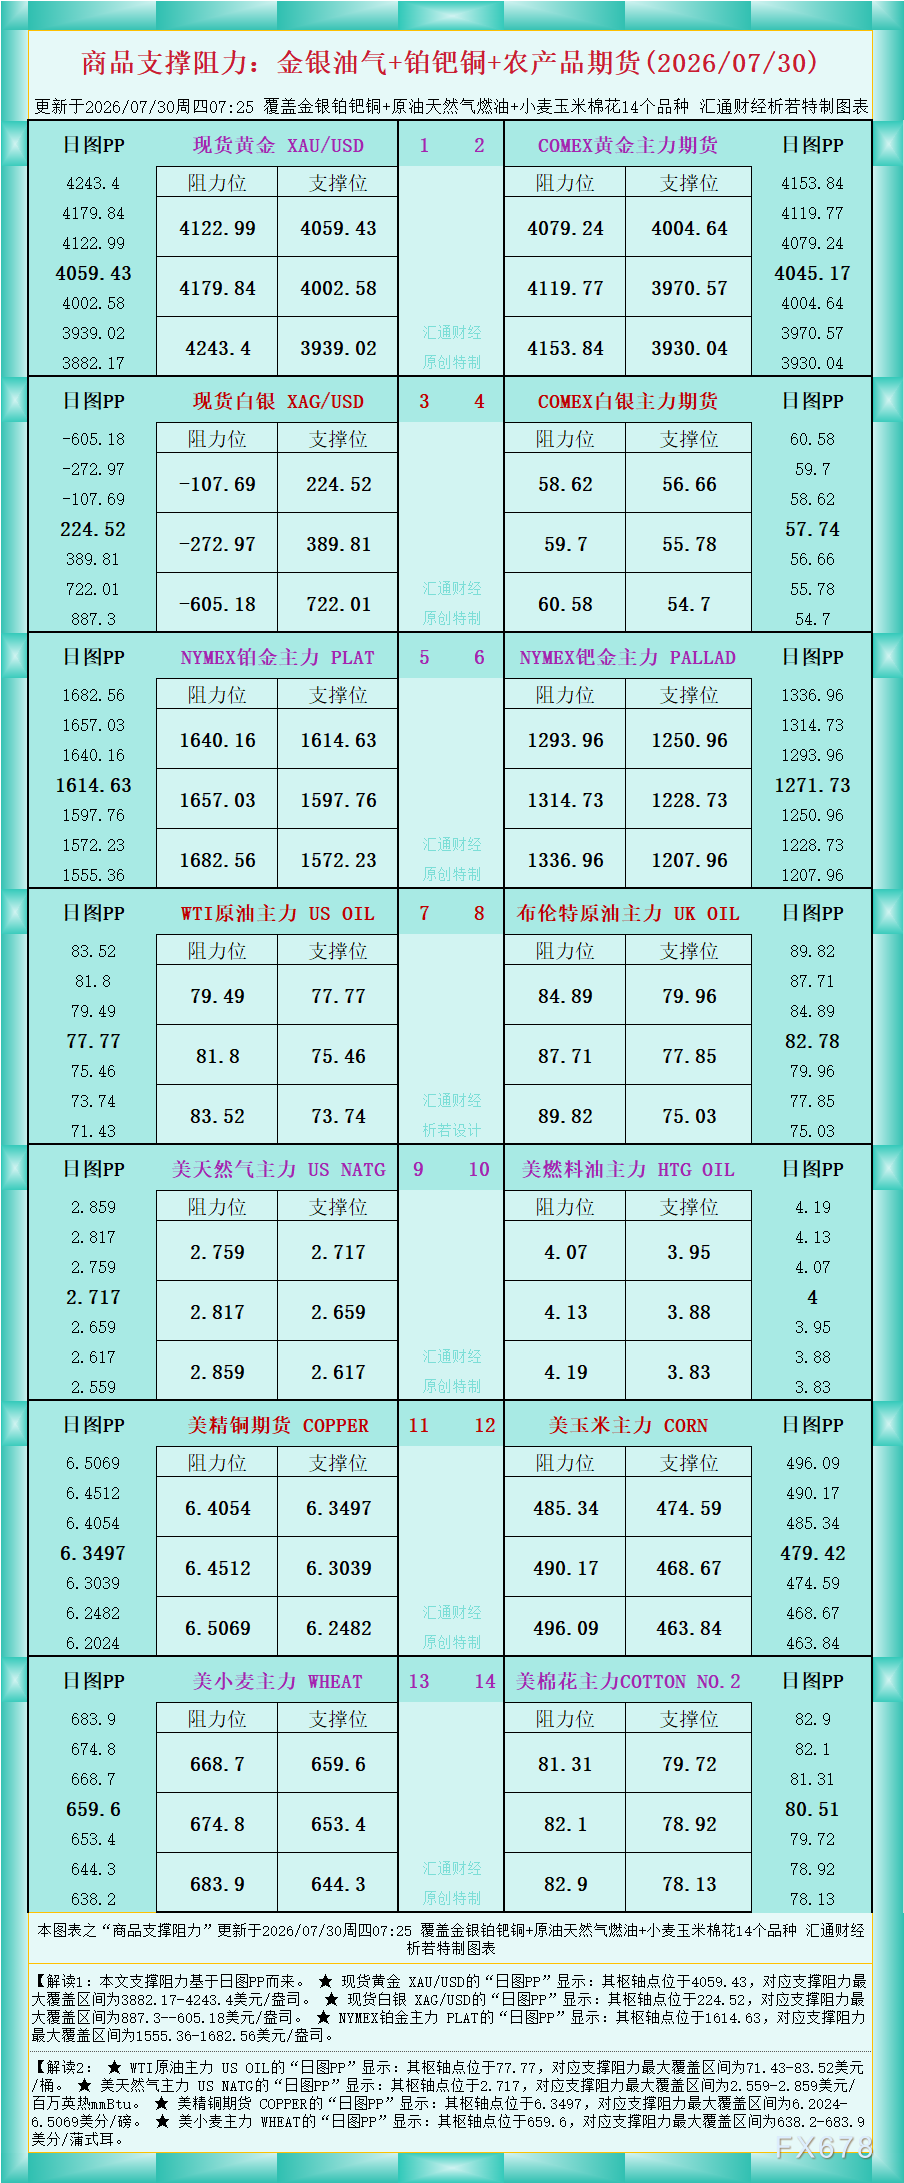
As the chart shows, Interpretation 1: The support and resistance in this article are based on the daily chart PP.
★ Spot gold XAU/USD "Daily Chart PP" shows: The pivot is at 4059.43, with a maximum support and resistance range of $3882.17-4243.4/oz.
★ Spot silver XAG/USD "Daily Chart PP" shows: The pivot is at 224.52, with a maximum support and resistance range of $887.3--605.18/oz.
★ NYMEX Platinum Main Contract PLAT "Daily Chart PP" shows: The pivot is at 1614.63, with a maximum support and resistance range of $1555.36-1682.56/oz.
Interpretation 2:
★ WTI crude oil main contract US OIL "Daily Chart PP" shows: The pivot is at 77.77, with a maximum support and resistance range of $71.43-83.52/barrel.
★ US natural gas main contract US NATG "Daily Chart PP" shows: The pivot is at 2.717, with a maximum support and resistance range of $2.559-2.859 per million British thermal units (mmBtu).
★ US copper futures COPPER "Daily Chart PP" shows: The pivot is at 6.3497, with a maximum support and resistance range of 6.2024-6.5069 cents/pound.
★ US wheat main contract WHEAT "Daily Chart PP" shows: The pivot is at 659.6, with a maximum support and resistance range of 638.2-683.9 cents/bushel.
For interpretations of more products, refer to the chart. Original custom-made by Fxstreet Finance, all rights reserved.
Disclaimer: The content of this article solely reflects the author's opinion and does not represent the platform in any capacity. This article is not intended to serve as a reference for making investment decisions.
You may also like
Private equity giant KKR (KKR.US) bets $3 billion on South Korea's AI supply chain, targeting data centers and power demand
KKR (KKR.US) is betting that South Korea's core position in the global artificial intelligence (AI) supply chain will continue to drive demand across various sectors, from data centers to electricity.
Gold, silver ease as stocks rally, Hormuz risk premium fades - Kitco PM Report
Silver targets $71.56 after trendline breakout, analysts see potential pullback
Venice VVV token hits record $34 as its privacy-AI staking model draws fresh bets
Crypto prices
More


