KiiChain (KII) is showing early signs of renewed bullish interest as traders defend key support levels. KII currently trades near $0.07136 after gaining 0.58% over the past 24 hours. Its seven-day performance also remains positive, supporting the recovery narrative across the market. Trading volume has reached about $210 million, highlighting strong activity around the token.
Moreover, KII holds a market capitalization of roughly $23.1 million with 320 million tokens circulating. The recent recovery has pushed price above its short-term EMA cluster near $0.06958. However, momentum indicators still point toward consolidation rather than a confirmed breakout.
The four-hour chart shows buyers repeatedly defending the $0.06600 to $0.06958 region. Consequently, this area has become an important foundation for the current recovery. Recent candles also show higher lows, suggesting that buyers have gradually improved their position.
KII now faces immediate resistance near $0.07141, which aligns with the 0.5 Fibonacci retracement. A sustained four-hour close above that level could attract additional buyers. Besides, the next major hurdle sits at $0.07578, corresponding with the 0.618 Fibonacci level.
A stronger breakout could then expose $0.08015, followed by $0.08637 and $0.09430. However, traders need stronger momentum before treating these levels as realistic short-term targets.
The ADX remains near 12.7, confirming that KII lacks a strong directional trend. Additionally, the +DI sits near 16.3, while the -DI stands around 16.5. That narrow difference highlights the ongoing battle between buyers and sellers.
| Level | Type | Significance |
| $0.09430 | Major resistance | Higher breakout target |
| $0.08637 | Resistance | Major upside barrier |
| $0.08015 | Resistance | Extension target |
| $0.07578 | Resistance | 0.618 Fibonacci level |
| $0.07141 | Immediate resistance | Breakout confirmation level |
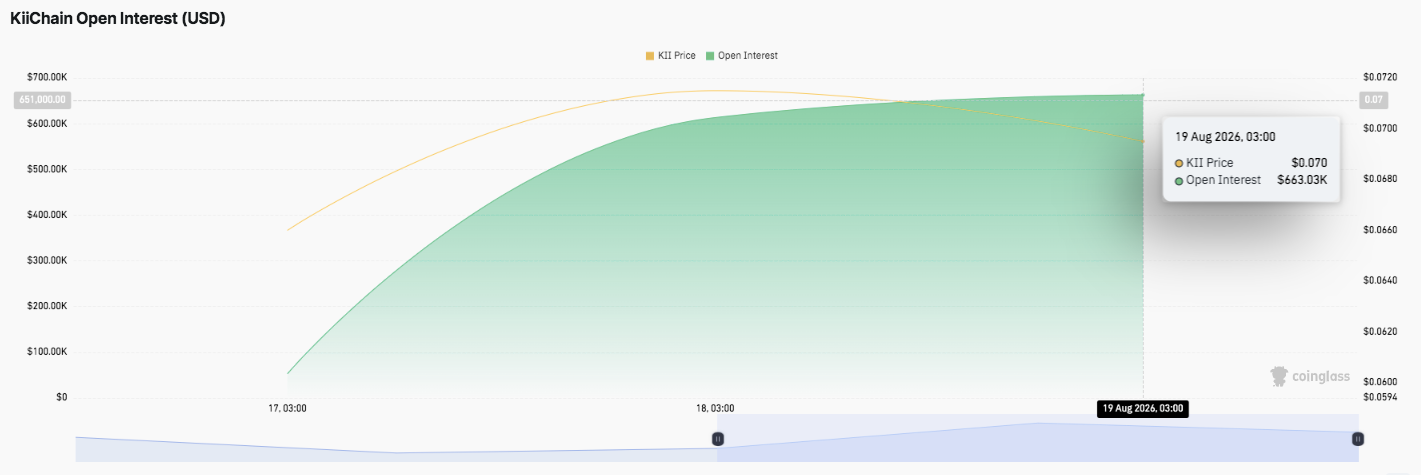
KII’s derivatives market has attracted considerably more attention over the past two days. Open interest climbed from roughly $50,000 on August 17 to about $663,000 on August 19.
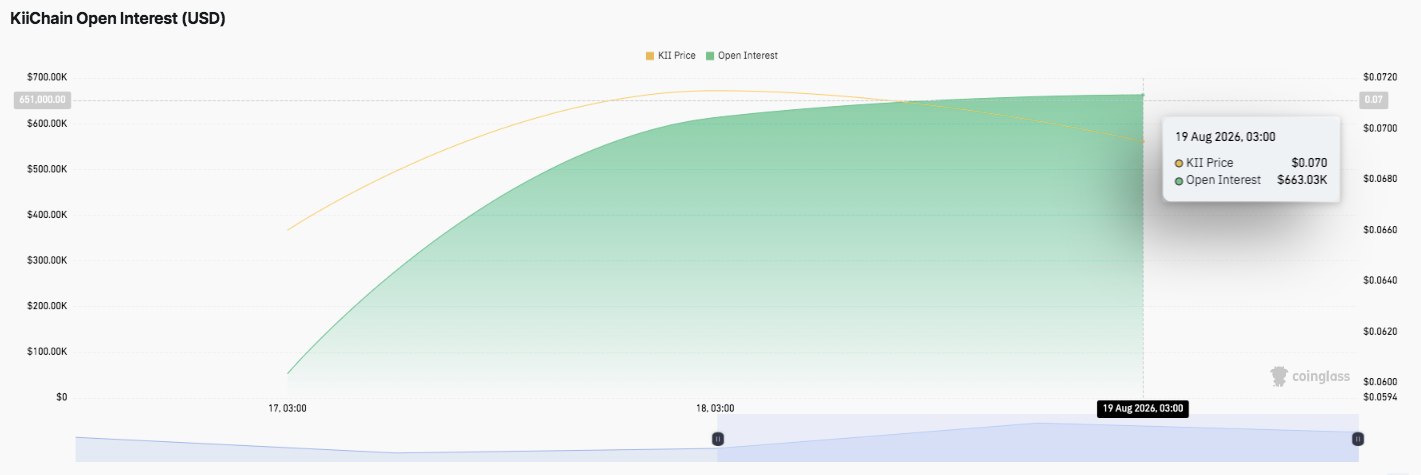
Significantly, this sharp increase accompanied KII’s price advance, suggesting traders added fresh leveraged positions. However, open interest has recently flattened around $650,000 to $663,000.
That slowdown could indicate hesitation among traders after the recent advance. Meanwhile, elevated leverage creates greater liquidation risks if KII experiences a sudden price reversal.
KII’s exchange flow data presents another important development for traders. Netflows have generally favored outflows, suggesting tokens have moved away from exchanges during the observed period.
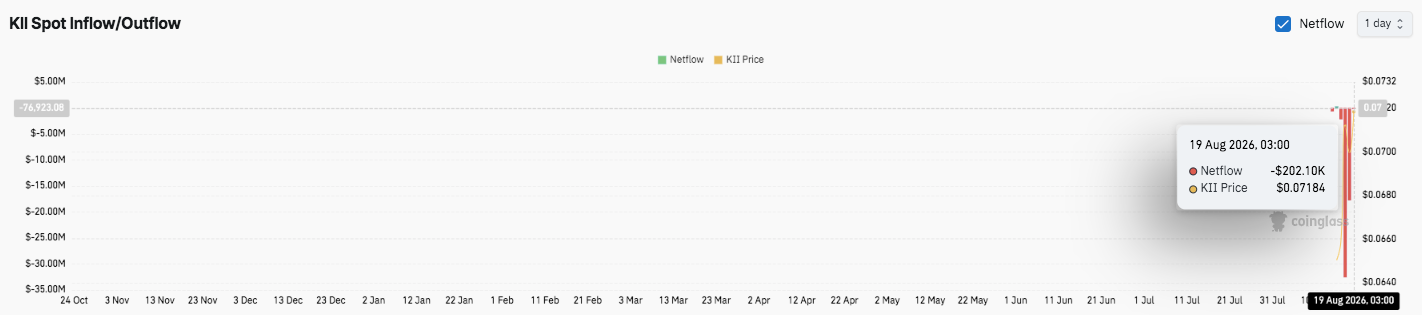
The strongest move occurred on August 19, when negative netflow reached roughly $32 million. Such withdrawals can reduce immediately available selling liquidity and potentially support accumulation.
However, large transfers can also signal heightened market activity. The latest reading showed netflow near negative $202,100 at 03:00, while KII traded around $0.07184.
Additionally, KiiChain’s August 19 tokenomics discussion could keep attention elevated around KII. The event features KiiChain leadership discussing launch figures, holder participation, and the network’s next developments.
Key levels remain well-defined for KiiChain as buyers attempt to extend the recovery:
Upside levels: $0.07141 and $0.07578 as immediate hurdles. A decisive breakout could push KII toward $0.08015, followed by $0.08637 and $0.09430.
Downside levels: $0.06958 EMA support, followed by $0.06600 and the major $0.05726 range floor.
Resistance ceiling: The $0.07578–$0.08015 zone represents the key area KII must reclaim for stronger bullish momentum. The technical picture shows KII recovering within a broader consolidation range, with higher lows suggesting improving buyer interest. However, weak ADX readings indicate limited trend strength.
KiiChain’s price outlook hinges on whether buyers can defend $0.06958 and break above $0.07141 with stronger volume. Rising open interest and substantial exchange outflows indicate growing market participation, but elevated leverage could amplify volatility.
If bullish momentum strengthens, KII could retest $0.07578 and $0.08015, with a broader breakout opening the path toward $0.08637 and $0.09430. Failure to hold $0.06958, however, could expose $0.06600 and potentially $0.05726. For now, KII remains at a pivotal technical juncture, with price action, liquidity flows, and derivatives positioning likely to determine its next major move.