

 coinedition.com
Uniswap’s $UNI token has entered a stronger trading phase as price momentum accelerates across the daily chart. $UNI recently climbed to around $8.59 after gaining 27.10% over 24 hours. The token also posted a 37.90% increase over the past seven days. Trading activity has expanded alongside the rally, with daily volume reaching nearly $1.76 billion.
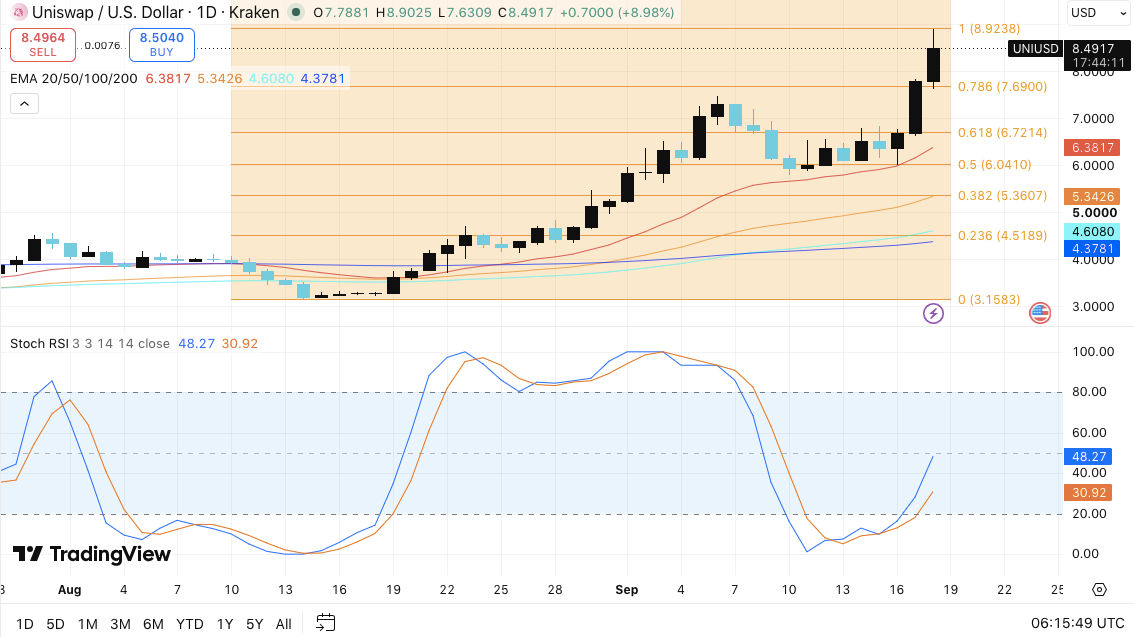
Consequently, $UNI now carries a market capitalization of about $5.34 billion. The latest advance also pushed price beyond a key Fibonacci barrier. However, traders now face a more important test near $8.92.
$UNI Momentum Builds Above Key Support
$UNI has moved decisively above several major moving averages during its latest advance. The token trades well above its 20-day EMA at $6.38. It also remains above the 50-day EMA at $5.34.
Additionally, $UNI holds above the 100-day EMA at $4.61 and 200-day EMA at $4.38. This alignment supports the broader upward structure on the daily timeframe.
 Uniswap Price Dynamics (Source: TradingView)
The latest rally also cleared the 0.786 Fibonacci level at $7.69. Hence, that level could become an important area for buyers during any pullback.
The next major obstacle sits between $8.90 and $8.92. A decisive move above this zone could open the door to further price discovery.
Related: Cardano Price Prediction: Can ADA Hold Its Breakout as On-Chain Activity Slides 72%?
However, rejection near that area could send $UNI back toward $7.69. Deeper support levels appear at $6.72, $6.04, and $5.36.
Rising Open Interest Adds Market Activity
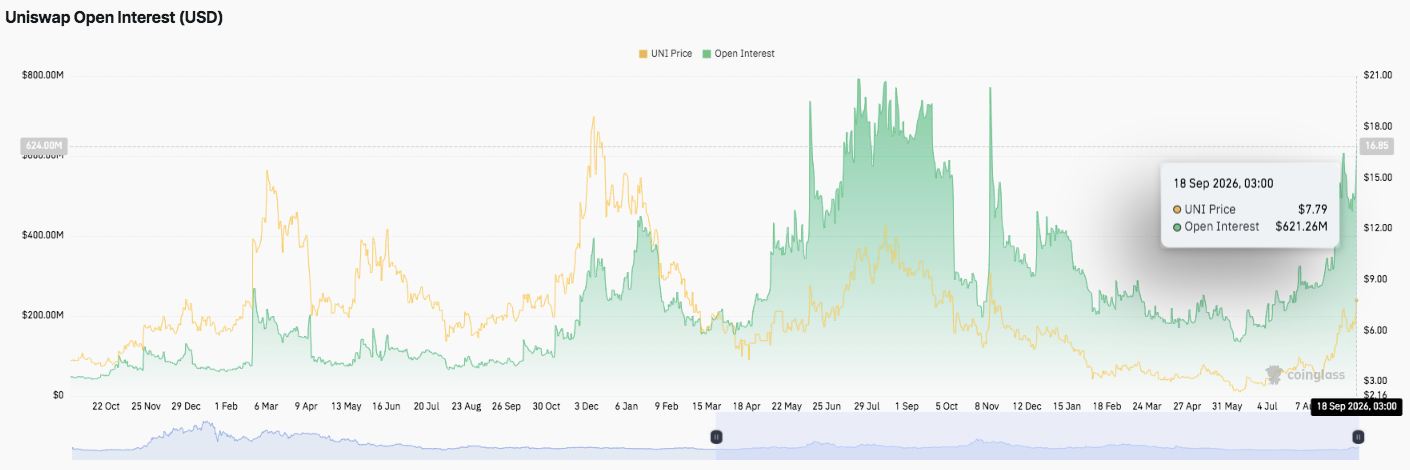
$UNI’s derivatives market has also become considerably more active during the recent recovery. Open interest fell toward roughly $150 million in late May.
It then recovered through June and July as $UNI strengthened. Open interest eventually moved above $700 million during the late-July peak.
 Source: Coinglass
That expansion later reversed as the token weakened through August. OI briefly dropped below $200 million before the market began recovering.
Significantly, open interest has since climbed sharply alongside $UNI’s latest price move. The latest reading places OI near $621.26 million.
This recovery shows that traders have rebuilt derivatives positions around $UNI. Besides, larger positioning can amplify price movements when the market reaches major technical levels.
Spot Flows Turn More Constructive
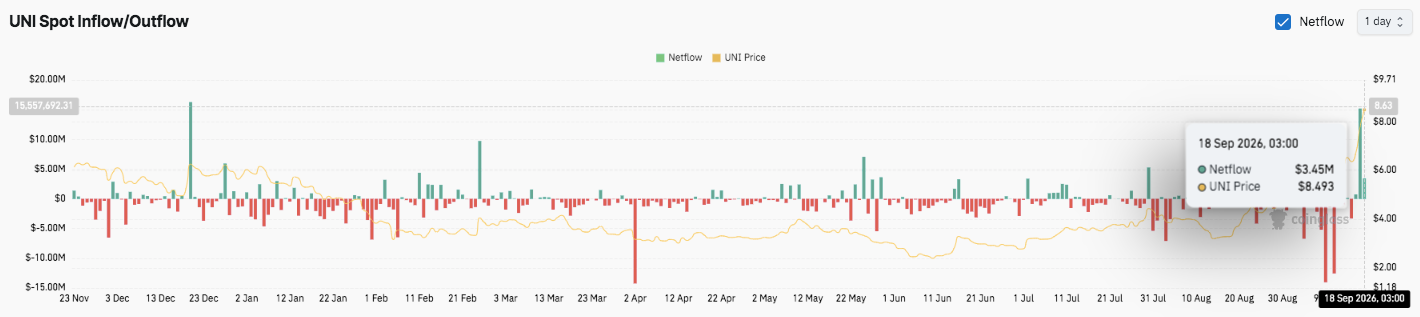
$UNI’s spot-market flows have remained volatile throughout the observed period. Outflows appeared frequently, while several large inflow spikes interrupted the broader pattern.
Notable inflow increases appeared around December, February, May, July, and September. More recently, inflows gained greater prominence as $UNI extended its rally.
 Source: Coinglass
The latest netflow reading reached approximately $15.56 million. Another recent reading showed an inflow near $3.45 million.
Related: Dash Price Prediction: Can DASH Clear $70 as Its Weekly Chart Turns Bullish?
Consequently, the latest data points toward stronger capital entering $UNI’s spot markets. However, alternating inflows and outflows still suggest that demand remains uneven.
Regulatory Adoption Could Create a New Catalyst
Another potential development could expand Uniswap’s relevance beyond traditional crypto markets. Recent commentary points to regulated securities markets exploring automated market-making infrastructure.
Permissioned tokenized-stock pools could eventually use Uniswap-style technology for continuous trading. Such markets could support programmable liquidity while operating under regulatory controls.
However, wider infrastructure adoption would not automatically increase $UNI token value. The key issue involves whether new deployments create direct economic value for the protocol.
A regulated U.S. venue using Uniswap infrastructure could therefore represent an important milestone. Additionally, fee-sharing or other value mechanisms could strengthen the connection between network usage and $UNI.
Technical Outlook For Uniswap
Key levels remain well-defined heading into October:
Upside levels: $8.92 is the immediate breakout hurdle. A sustained move above this level could expose higher price discovery, with $9.50 and $10.00 as potential psychological targets.
Downside levels: $7.69 is the first major support, followed by $6.72, $6.04, and $5.36. Holding $7.69 would help preserve the recent breakout structure.
Resistance ceiling: $8.90–$8.92 remains the key zone for confirming further upside momentum. A decisive break could strengthen $UNI’s current bullish structure.
The technical picture shows $UNI trading well above its 20-day EMA at $6.38. It also remains above the 50-day, 100-day, and 200-day EMAs. Hence, the broader trend continues to favor buyers.
Will Uniswap Go Up?
Uniswap’s October outlook hinges on whether buyers can defend $7.69 after the recent surge. The $8.90–$8.92 area now represents the critical test for the next move.
If buying pressure strengthens and $UNI clears $8.92, the rally could extend toward $9.50 and the psychological $10.00 level. Rising open interest and recent positive spot flows could provide additional market momentum.
However, rejection at resistance could trigger a pullback toward $7.69. Losing that support would expose $6.72 and potentially $6.04.
Related: Cronos Price Prediction September 2026: Can CRO Reclaim Its Bull Market Support Band?
For now, $UNI remains at a pivotal technical zone. The combination of stronger derivatives activity, improving spot flows, and the tokenized-asset narrative could keep volatility elevated heading into October.


