- UNI approaches $10 after a sharp recovery, with rising volume supporting stronger market participation near resistance.
- Liquidations have expanded sharply as price climbed, showing greater leverage and volatility across perpetual markets.
- The $9.20–$9.30 zone remains important before the market tests the psychological $10 threshold.
UNI is approaching a major psychological level after recovering sharply from its multi-month low. Rising volume and expanding liquidations now accompany the latest advance toward resistance.
UNI Moves Toward the $10 Threshold
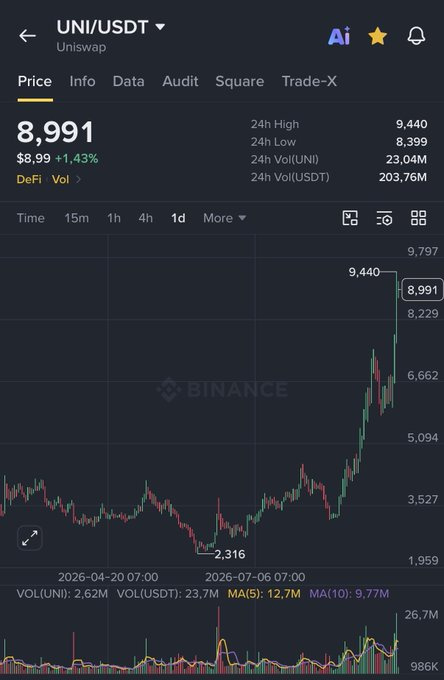
The latest daily chart shows a sustained recovery from the $2.316 low. Price gradually established higher ranges before accelerating above the $5 area. The advance then extended through $6, $7, and $8.
The supplied charts only establish the immediate technical levels.
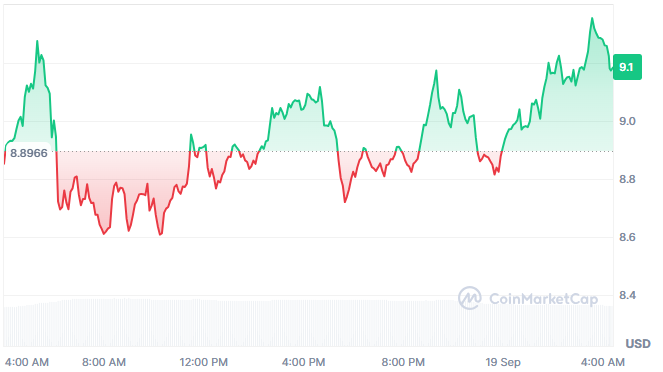
The latest price chart places the token near $9.18, up 2.86% over 24 hours. It previously reached approximately $9.25 during the displayed session. Price has remained close to the upper portion of its recent range.
The immediate area of resistance is around $9.20 – $9.30 in the intraday chart. If the trend continues to move higher than that area, $10 may become more apparent. A rejection could instead return the price toward nearby support around $8.90.
Trading Activity Intensifies During the Advance
According to market data, trading on the platform is around $1.85 billion in a day. That figure increased 3.73% alongside the latest price movement. Market capitalization stood near $5.7 billion on the displayed data.
The daily chart also shows stronger volume during the recent upward acceleration. Five-period average volume stood near 12.7 million, against displayed volume near 23.7 million. This reflects increased activity during the latest advance.
The perpetual liquidation chart provides another view of the market’s changing conditions. Liquidation activity remained relatively contained from March through July. Larger events became more frequent as price began climbing during August.
That pattern intensified throughout September as price approached the $9–$10 region. Both long and short liquidations became larger around the latest advance. The expanding bars point to greater forced-position activity across leveraged markets.
Leverage Adds Volatility Near Resistance
One of the largest green liquidation spikes appeared during the early September advance. Several red liquidation events followed as price continued moving higher. This shows that volatility increased as leveraged positions accumulated around rising prices.
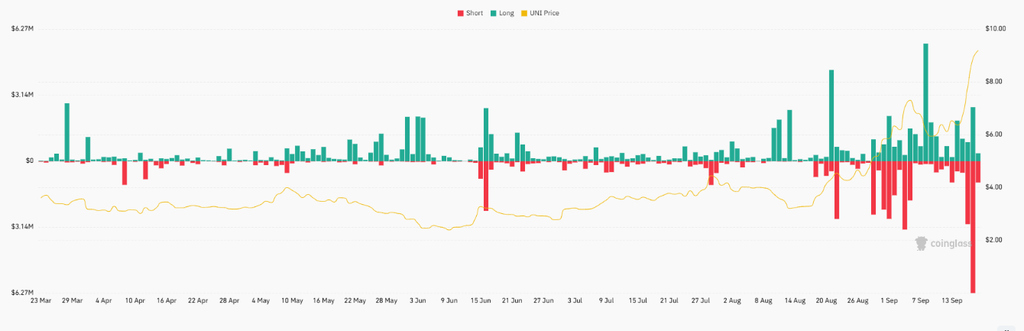
The final section contains an especially large red liquidation bar. It appeared after the market had already advanced considerably. Such activity indicates that derivatives positions remained sensitive to relatively modest price changes.
Still, liquidation data cannot identify trader intentions or determine the next market direction. The figures instead show where leveraged positions were forcibly closed. Price action and volume therefore remain important alongside the liquidation data.
As of writing, the market remains focused on $9.20–$9.30 and the $10 threshold. Holding above nearby support would preserve the recent sequence of higher trading ranges. Rejection could create consolidation before another attempt toward higher levels.