Two warning lights came on at once this week, and neither is conclusive on its own. Strategy moved 3,568 BTC worth roughly $297 million out of its wallets over nine hours, according to Lookonchain. At the same time, Glassnode data shows spot traders rotating into altcoins at the fastest pace in a year. Claude AI predicts Bitcoin holds its breakout for now, but both signals argue for caution rather than chasing.
BTC trades near $84,285, up 0.94% on the day. The token is holding above the level it reclaimed last week, though the move has lost momentum.
Is Strategy Selling or Just Moving Wallets?
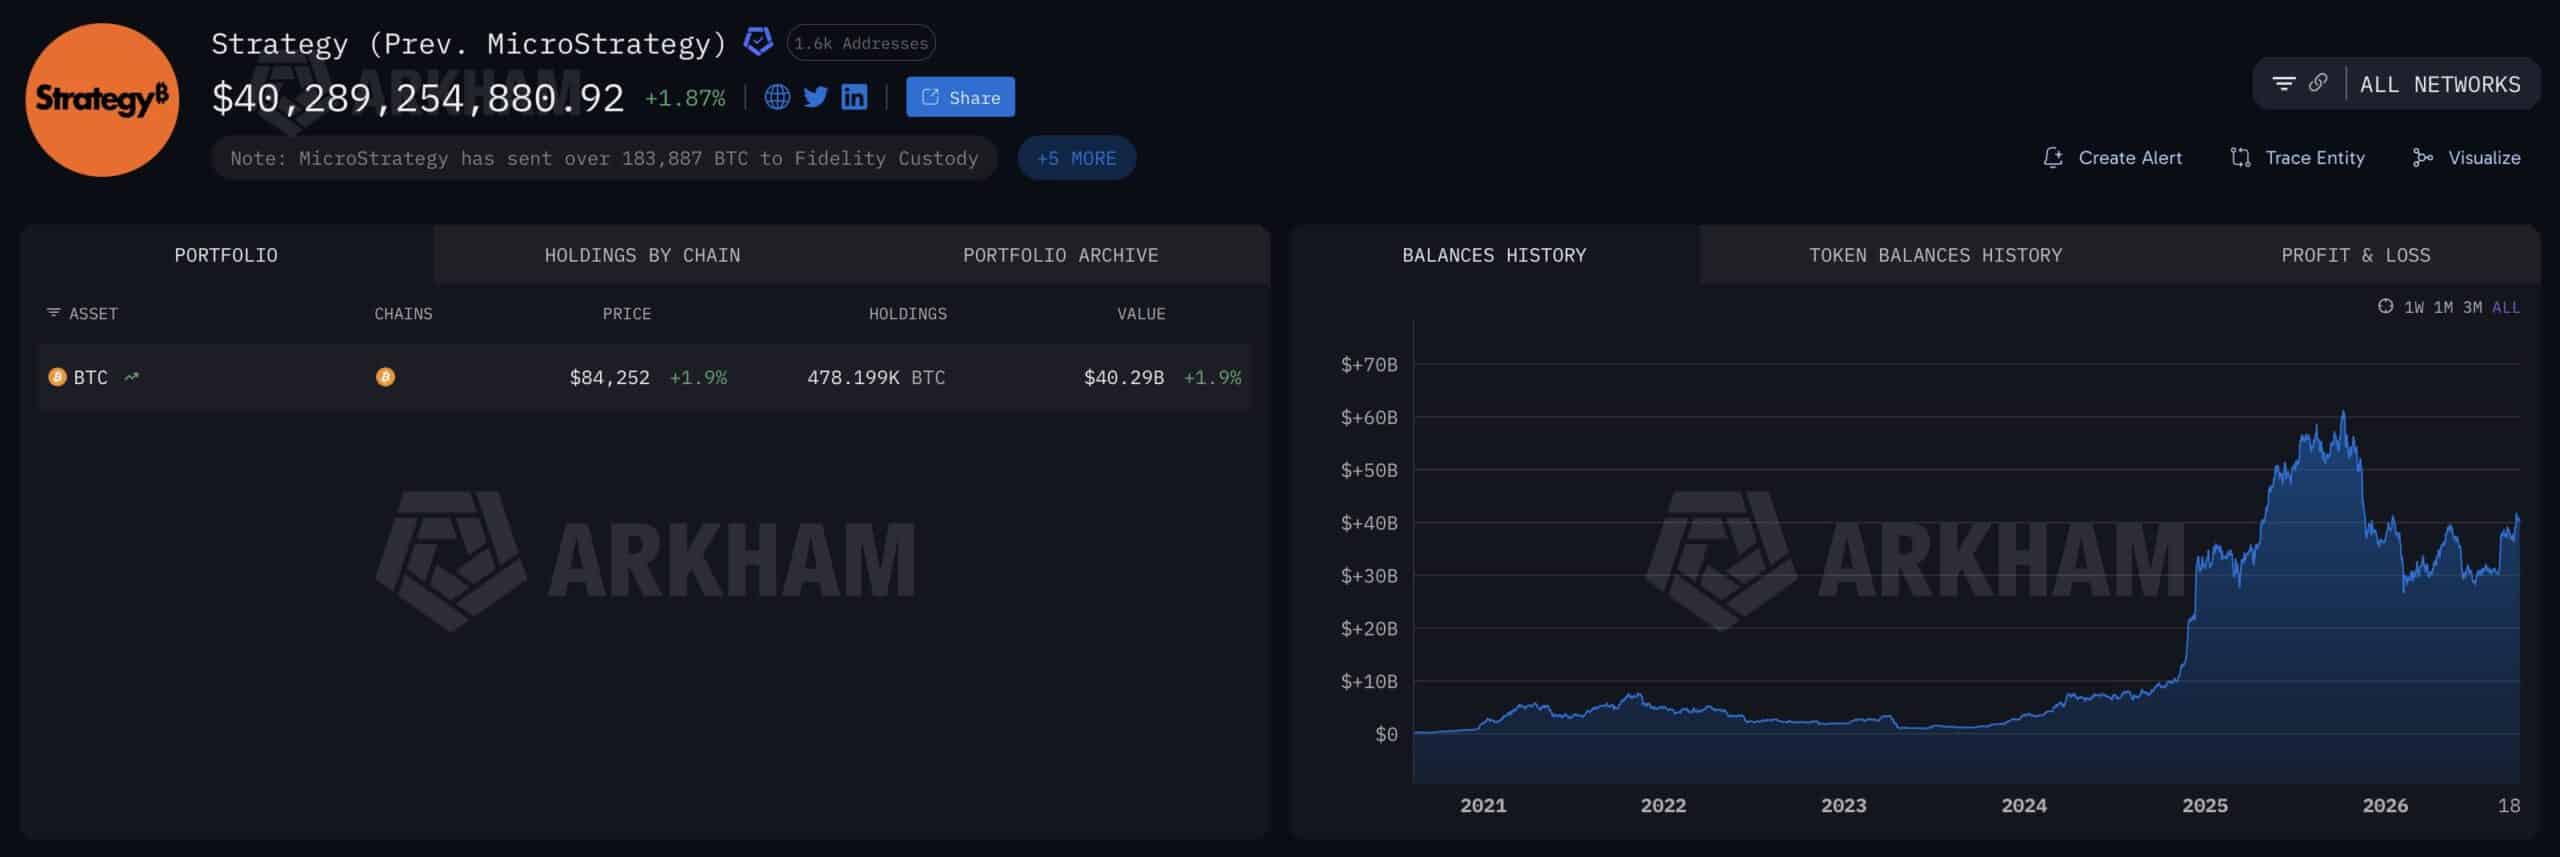
Strategy (Prev. MicroStrategy) Arkham
Nobody outside the company knows yet, and that is the honest answer. What is verifiable is the flow. Over a nine-hour window, 3,568 BTC left addresses attributed to Strategy. At current Bitcoin prices that is about $297 million.
The timing is what makes it odd. Strategy bought 1,665 BTC at an average of $85,681 just days ago, its second consecutive weekly purchase. Buying one week and transferring out the next is not the behavior of a straightforward accumulator.
There are innocent explanations. Companies rotate custody providers, restructure wallet architecture, and reorganize holdings for accounting or security reasons. None of that requires selling a single coin.
There is also precedent for the less comfortable reading. Strategy sold 6,916 BTC over the summer to cover preferred dividends and reduce debt, at prices below $65,000.
Treat this as an open question. On-chain movement is not the same as a sale, and attributing intent to a wallet transfer is how people get caught out.
Why Does Altcoin Volume Signal a Local Top?
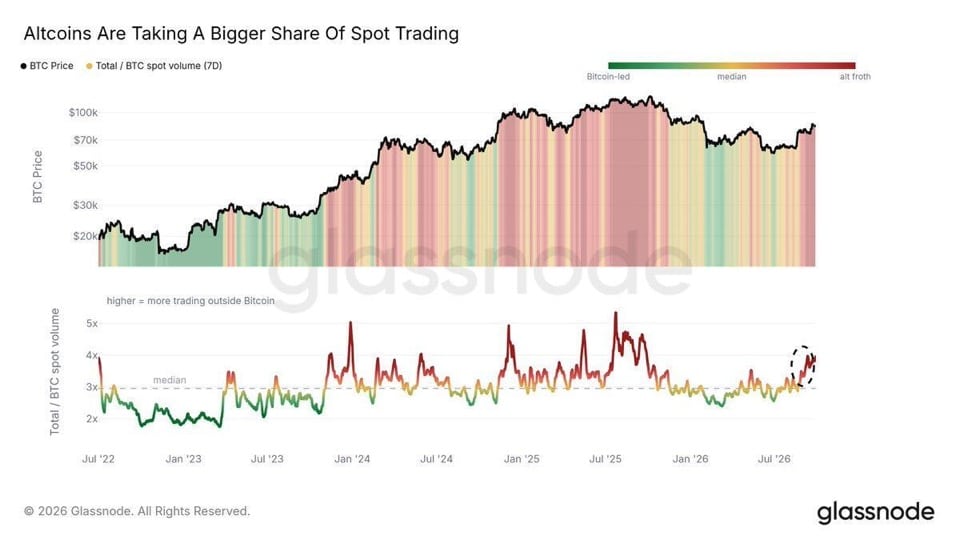
Altcoins Share Glassnode
This signal is cleaner, and it is less comfortable. Total spot volume across crypto now runs close to four times Bitcoin’s own, the highest reading since September 2025. In plain terms, money is moving out of BTC and into everything else.
Glassnode’s framing is worth quoting directly: demand for higher risk like this has often lined up with local tops in Bitcoin.
The logic is behavioral. Traders rotate into altcoins when they feel confident, which usually happens after a strong Bitcoin run rather than before one. By the time the crowd is chasing smaller caps, the easy move in BTC has already happened.
Look at the history on Glassnode’s chart, and the pattern repeats. The deep-red readings in early 2025 and mid 2025 both occurred near local highs, not at the start of new legs.
This does not mean a crash. It means the risk of buying here is higher than it was at $75,000 two weeks ago.
AI Predicts Bitcoin Levels: Where Does the Trend Break?
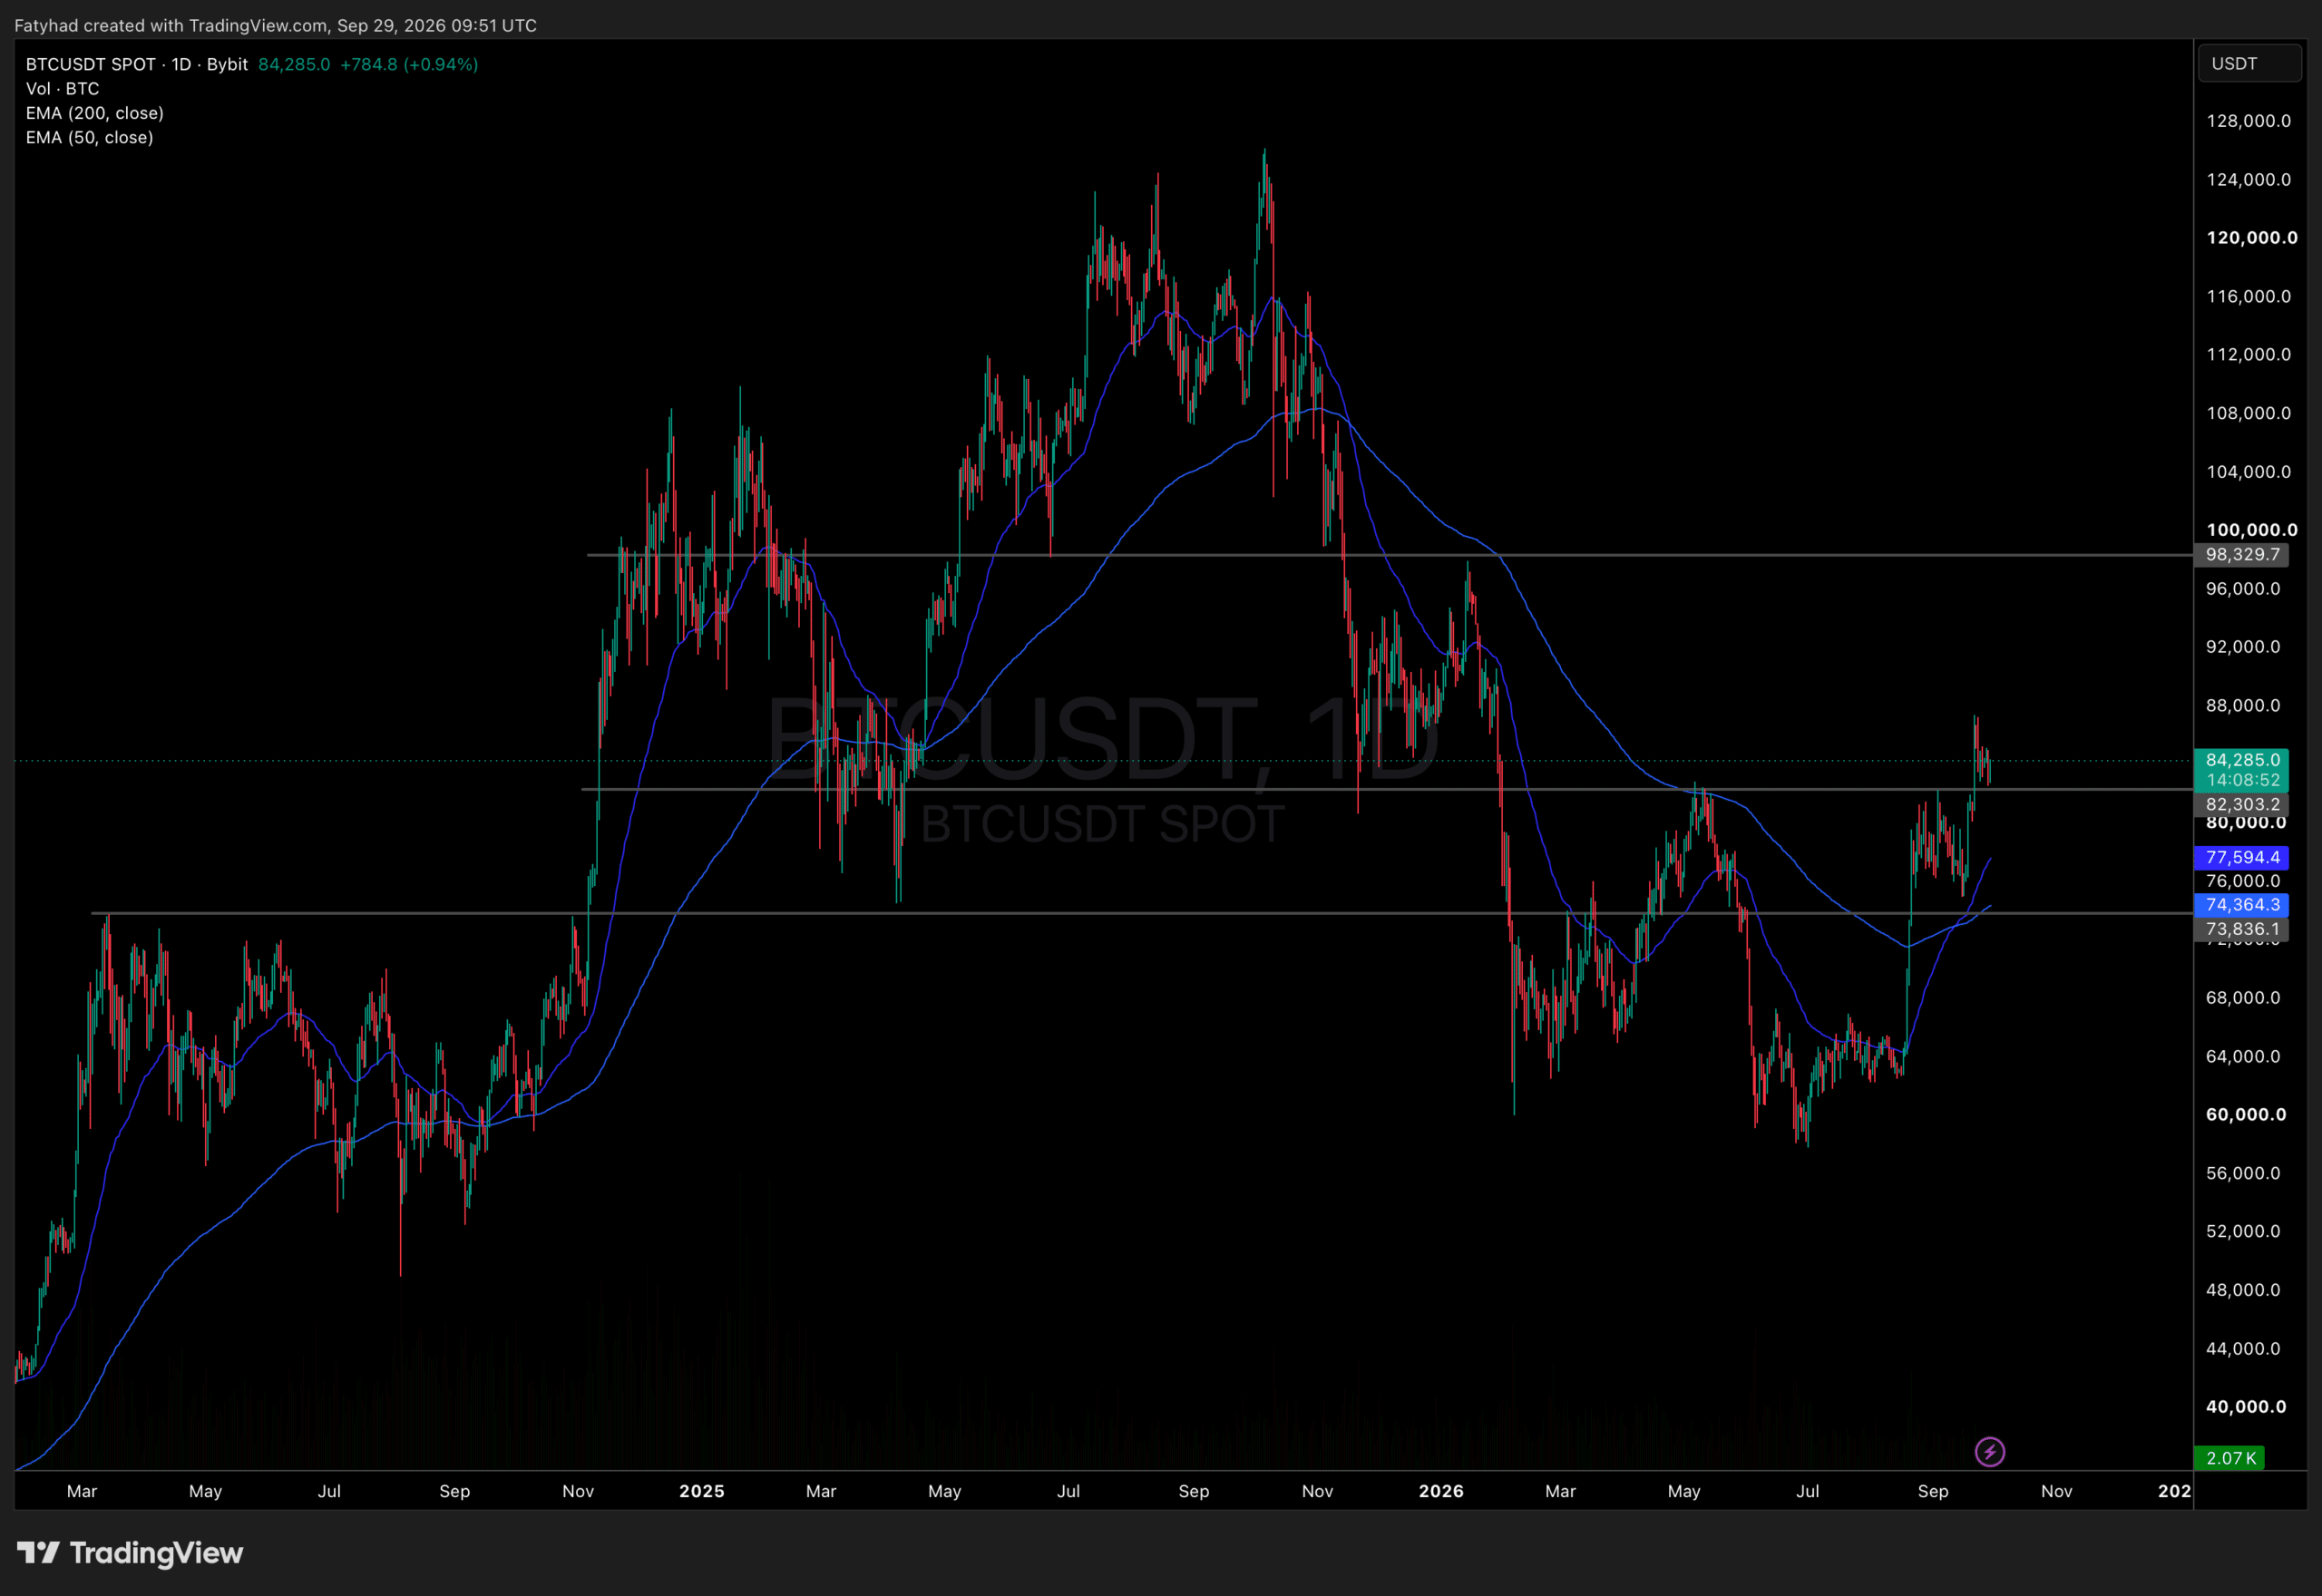
BTCUSDT Chart 1D TradingView
The chart is still constructive, which is the counterweight to both signals above. Bitcoin holds above $82,303, the level that rejected it in May and September and now acts as support. The 50-day EMA at $77,594 sits above the 200-day EMA at $74,364, and both continue to rise.
AI predicts Bitcoin will be decided at these levels:
- The line to hold: $82,303. Daily closes above it keep the breakout structure intact.
- The test above: $88,000 to $90,000. The nearest supply band, and the level that would invalidate the local top argument.
- The bigger target: $98,330. The final barrier before $100,000, realistically a year-end objective.
Below the breakout, $77,594 and then $74,364 form the backstop. That zone has absorbed every pullback since August.
The setup is finely balanced. Corporate buying and a rising moving average structure support the trend, while altcoin rotation and an unexplained $297 million transfer argue the other way.
Watch $82,303. Holding it means the signals were noise. Losing it means they were early.