

Ripple (XRP) ETF
Solana (SOL) ETF
XRP and SOL ETF Demand Craters as Weekly Inflows Drop 94%+
Bitget offers one-stop trading for cryptocurrencies, stocks, and gold. Trade now!
A welcome pack worth 6200 USDT for new users! Sign up now!
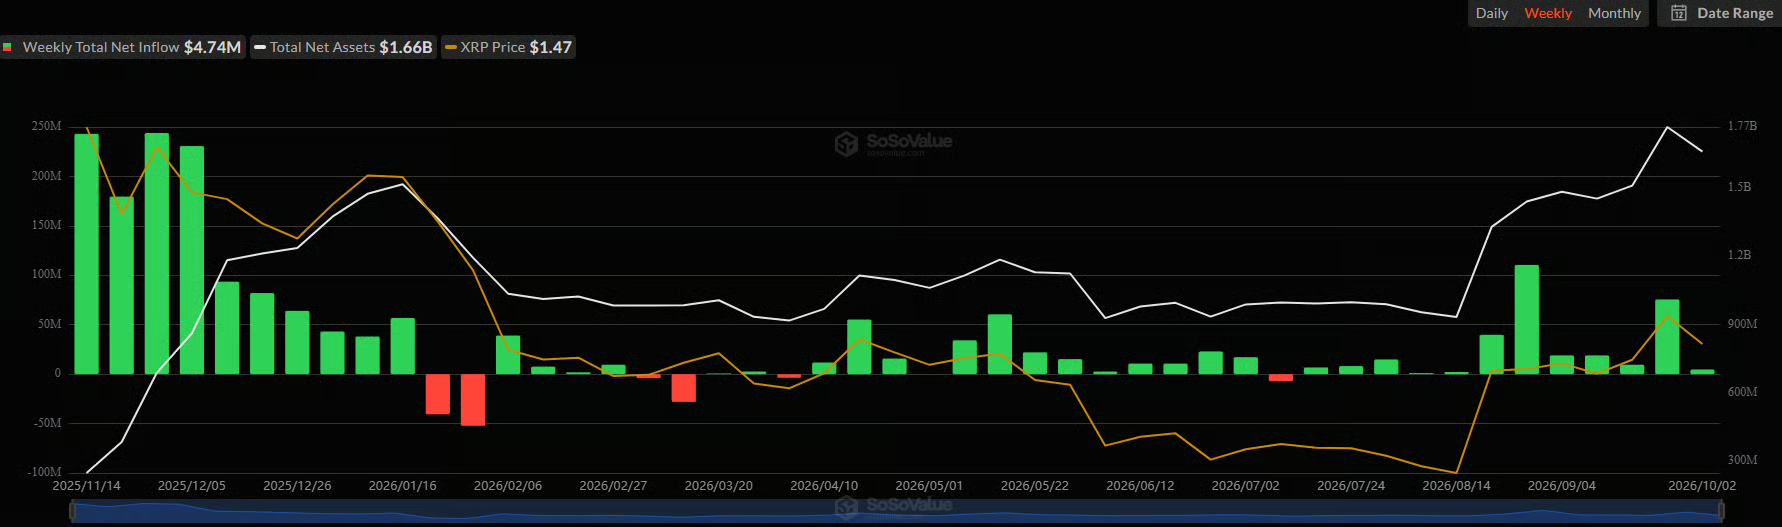
Although the spot XRP ETFs have maintained their positive net flow streak, the actual numbers are quite concerning as the weekly decline is roughly 94%.
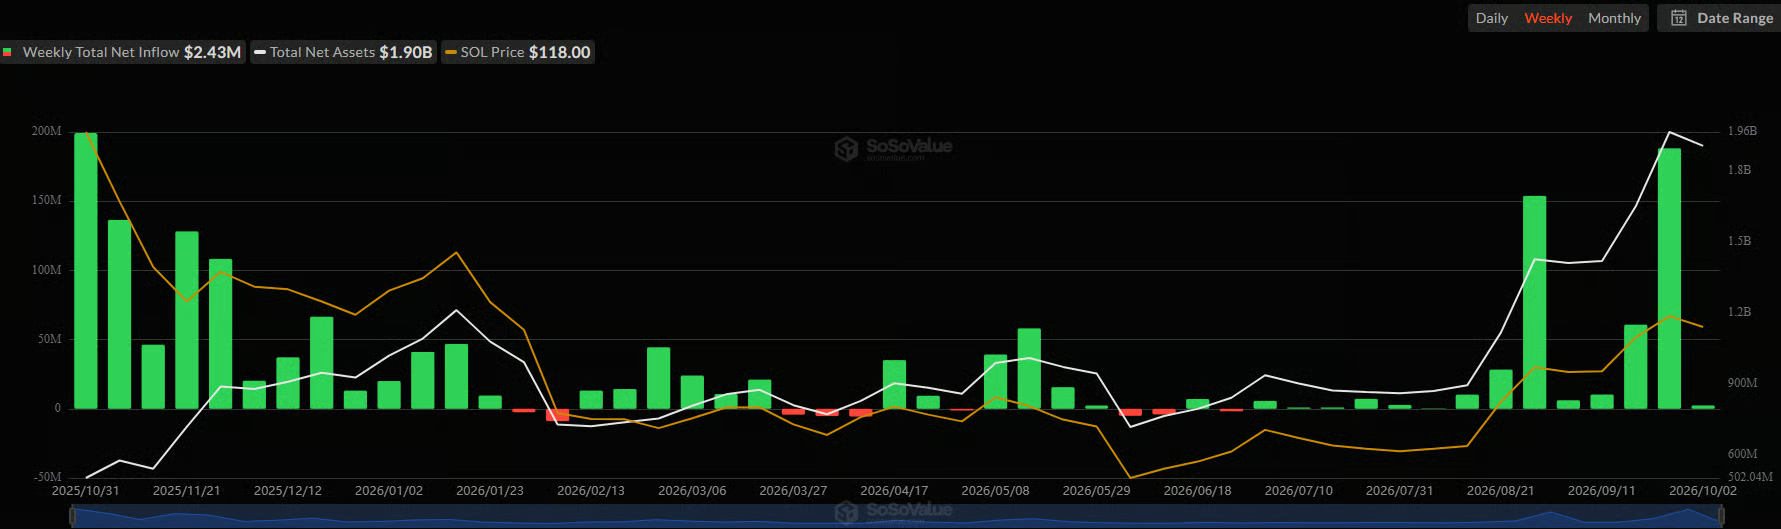
The funds tracking the performance of Solana’s SOL experienced an even more profound drop in the numbers, going down from over $188 million to under $2.5 million.
94% Decline in XRP ETF Inflows
The business week began on a higher note for the Ripple ETFs, with investors pouring in almost $4 million. However, a familiar sight returned on Tuesday and Wednesday, as SoSoValue shows $0.00 for both days. In other words, the demand simply evaporated for two straight days. This was common during the sluggish summer months, but it hasn’t been the case for the past several weeks.
Investors allocated another $4.07 million on October 1, thus ending the two-day dry spell. However, the tide turned on Friday, with $3.28 million in net outflows. This became the first red day for the XRP ETFs since September 18. Consequently, the week ended with $4.74 million in net inflows.
On the positive side, this means that the financial vehicles extended their streak of consecutive green weeks to 12. However, a deeper look into the actual numbers shows that the funds experienced a 94% decline in weekly net inflows, as they attracted $75.59 million during the previous five-day trading period that ended on September 25.
Spot XRP ETF Inflows. Source: SoSoValue
Meanwhile, the underlying asset was rejected twice in the past week at $1.55 and even dipped to $1.45 on Friday during the market-wide correction. It has recovered some ground since then and currently fights for the $1.50 level.
SOL ETFs in a Worse State
The spot Solana ETFs had their second-best week in terms of net inflows last week, with $188.22 million entering the funds. However, their five-day performance slumped by over 97% to $2.43 million. This was somewhat surprising given how the week started, as the financial products gained $12.70 million on Monday and another $5.44 million on Tuesday.
You may also like:
- XRP in October: Will Ripple’s Streak Continue After 3 Consecutive Green Months?
- Bitwise CIO Explains XRP’s Institutional Appeal After 80% ETF Jump
- XRP ETFs Attract $75M in a Week as SOL Funds Hit New 2026 High
However, investors reversed their stance on Wednesday with $11.10 million in net inflows and $5.91 million on Thursday. Friday was slightly in the green ($1.30 million), which helped save the weekly inflow streak.
Spot Solana (SOL) ETF Flows. Source: SoSoValue
SOL’s price jumped above $123 in the middle of the week, but the Friday crash pushed it to under $118. The subsequent recovery has helped it reclaim the $129 level as of press time.
0
0
Disclaimer: The content of this article solely reflects the author's opinion and does not represent the platform in any capacity. This article is not intended to serve as a reference for making investment decisions.
Understand the market, then trade.
Bitget offers one-stop trading for cryptocurrencies, stocks, and gold.
Trade now!
You may also like
BUZZ - India's M&M Finance sees biggest 10-week surge in stock price due to growth in quarterly lending
On October 5, shares of non-bank lender Mahindra & Mahindra Financial Services (MMFS.NS) jumped as much as 6.53%, marking the largest intraday gain in 10 weeks, reaching 340.3 rupees per share; MMFS most recently rose 2.6%. According to MMFS’s business update, total lending in the September quarter rose 22% year-on-year to 164.9 billion rupees, boosting the stock price. Collection efficiency for Q2 of FY2027 reached 97%, compared to 96% in Q2 of FY2026. Morgan Stanley stated that MMFS’s Q2 update indicates good asset quality and a recovery in loan growth. However, Morgan Stanley and Jefferies reiterated a cautious outlook on FY2027 earnings due to insufficient monsoon and geopolitical uncertainties. Exchange data show that MMFS shares have fallen 18.8% so far this year. (For the convenience of non-English speakers, Reuters has generated automated translations of this report in several other languages. As automated translations may contain errors or lack necessary context, Reuters does not guarantee the accuracy of the automated translation and provides it solely for the reader’s convenience. Reuters assumes no liability for any damage or loss caused by the use of automated translation functions.)
路透社•2026/10/05 06:16
BUZZ - Shares of Varun Beverages rise as PhillipCapital initiates coverage with a 'Buy' rating
October 5th – PhillipCapital stated that PepsiCo’s domestic bottler, Varun Beverages (VARB.NS), will benefit from market opportunities, product innovation, and strong distribution moat. The brokerage initiated coverage on the stock with a “Buy” rating and set a target price of 560 rupees. PhillipCapital pointed out that the company’s recent business expansions—including KIVA Spirits, the Asahi partnership in India, and collaboration with Carlsberg in Africa—offer additional growth potential not yet reflected in the share price. VARB’s introduction of new consumer product categories, such as zero-sugar carbonated soft drinks, energy drinks, sports drinks, and dairy-based beverages, helps solidify its value base, attract health-conscious consumers, and promote product premiumization. Although there are competitive threats, the brokerage believes that in India's soft drink market, where penetration is still low, new mainstream contenders are more likely to expand the overall market rather than take significant share from existing players. Out of 25 analysts, 22 assign the stock a “Buy” or higher rating; the median target price is 556 rupees. The company’s share price rose 1.7% to 432.55 rupees, with a year-to-date decline of 11.6% (To facilitate non-English speakers, Reuters provides automated translations of its reports into several other languages. As automated translation may be inaccurate or lack the required context, Reuters does not guarantee the accuracy of automated translations and provides them for reader convenience only. Reuters accepts no liability for any damage or loss caused by the use of automated translation features.)
路透社•2026/10/05 06:11
10-Yr Benchmark Govt Yields - U.S. vs Other Nations
Current Spread in Yield Basis Points U.S. 5.262 % Australia 5.347 % 8.5 Belgium 4.339 % -92.3 Canada 3.944 % -131.8 Denmark 3.268 % -199.4 France 4.866 % -39.6 Germany 3.475 % -178.7 Italy 4.604 % -65.8 Japan 3.091 % -217.1 Netherlands 3.577 % -168.5 Spain 4.087 % -117.5 Sweden 3.146 % -211.7 U.K. 5.369 % 10.7 Source: Tullett Prebon via FactSet (END) Dow Jones Newswires October 05, 2026 01:10 ET (05:10 GMT)
Dow Jones•2026/10/05 05:10
10-Yr Benchmark Govt Yields - Germany vs Other Nations
Current Spread in Yield Basis Points Germany 3.475 % Australia 5.347 % 187.2 Belgium 4.339 % 86.4 Canada 3.944 % 46.9 Denmark 3.268 % -20.7 France 4.866 % 139.1 Italy 4.604 % 113.0 Japan 3.091 % -38.4 Netherlands 3.577 % 10.2 Spain 4.087 % 61.2 Sweden 3.146 % -32.9 U.K. 5.369 % 189.4 U.S. 5.262 % 178.7 Source: Tullett Prebon via FactSet (END) Dow Jones Newswires October 05, 2026 01:10 ET (05:10 GMT)
Dow Jones•2026/10/05 05:10
Crypto prices
More
Bitcoin
BTC
$85,902.66
+1.10%

Ethereum
ETH
$2,711.82
+0.65%

Tether USDt
USDT
$0.9997
-0.01%

BNB
BNB
$792.53
+0.77%

XRP
XRP
$1.51
+1.34%

USDC
USDC
$1.0000
+0.00%

Solana
SOL
$120.93
-0.01%

TRON
TRX
$0.3349
-0.11%

Hyperliquid
HYPE
$91.33
+1.58%

Zcash
ZEC
$1,322.35
-0.44%
How to buy BTC
Bitget lists BTC – Buy or sell BTC quickly on Bitget!
Trade now
Become a trader now?A welcome pack worth 6200 USDT for new users!
Sign up now