$XRP Forms Right-Angled Descending Broadening Pattern
For the uninitiated, a right-angled descending broadening formation has two trendlines that move farther apart, creating a widening price channel.
The upper trendline stays flat and acts as resistance, while the lower trendline moves downward as price records a series of lower lows. Despite the falling lower trendline, this pattern has a bullish bias when it forms during a downtrend.
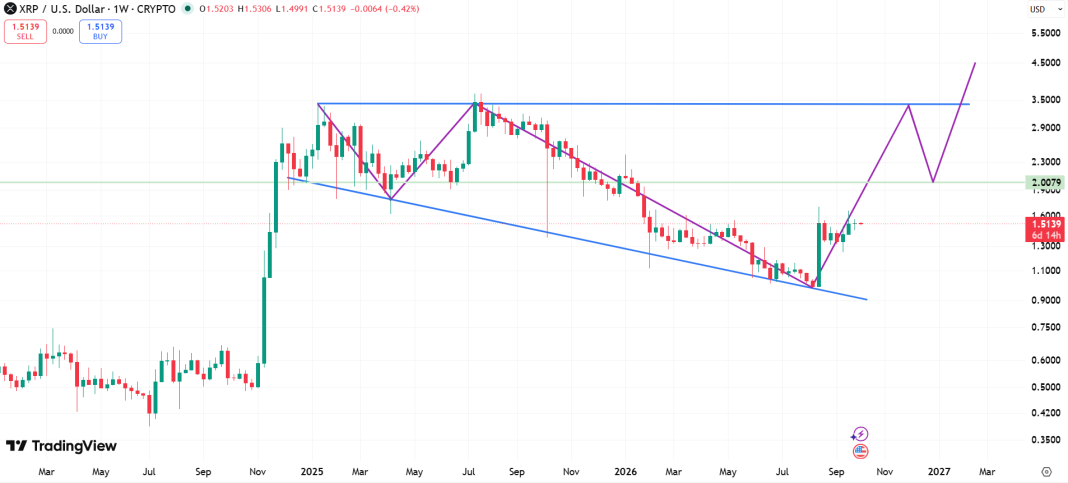
$XRP started forming the structure after its impressive November 2024 rally, which came as optimism grew around Donald Trump’s election victory. Specifically, the price rose from $0.50 in November 2024 to an initial high of $3.40 by January 2025. This top matched the flat upper trendline of the formation.
$XRP then dropped to $1.60 by April 2025, marking its first test of the falling lower trendline. Buyers stepped in at this level and pushed $XRP back toward the upper boundary. The recovery eventually took the token to a new all-time high of $3.66.
However, the resistance around this level matched the upper trendline and stopped the growth. $XRP then entered a prolonged decline, falling from around $3.00 to $0.98 by August 2026, a drop of roughly 67%, leading to a retest of the lower trendline. This second test further confirmed the formation.
 $XRP
$XRP Right Angled Descending Broadening Formation
$XRP’s Path to the Upper Trendline
After $XRP tested the lower trendline at $0.98, the token began the ongoing recovery and has since climbed to $1.51, a gain of more than 54% from the August 2026 low. The rebound shows that buyers again stepped in around the lower boundary, which supports the bullish case for the pattern.
However, $XRP is still way below the upper trendline. This level sits near $3.50, meaning $XRP would need to rise another 131% from $1.51 just to reach the area where a breakout attempt could take place.
Previous price action also suggests that $XRP could face another pullback before reaching $3.50, which could give buyers time to consolidate before making another attempt to break through the resistance.
The Breakout Target
If $XRP breaks above the $3.50 upper trendline and confirms the bullish resolution of the pattern, the measured move leads to a target near $6.00.
This target comes from an evaluation of the widest part of the formation. Specifically, the distance between the upper trendline at $3.50 and the lowest low at $0.98 is $2.52. Adding that $2.52 range to the $3.50 breakout level gives a target of around $6.00.
A move to $6.00 would give $XRP a new all-time high and put the token nearly 70% above the $3.50 upper trendline. However, $XRP would first need to maintain its recovery, build enough momentum, and overcome the resistance level that has already rejected the price twice.


 thecryptobasic.com