
A chart visualizing commodity support and resistance: gold, silver, oil, gas, platinum, palladium, copper, agricultural futures (October 6, 2026)

Huitong Network, October 6 — One chart for commodities support and resistance: gold, silver, oil, gas + platinum, palladium, copper + agricultural futures, updated at 12:00 (UTC+8), Tuesday, October 6, 2026, covering 14 products including gold, silver, platinum, palladium, copper + crude oil, natural gas, fuel oil + wheat, corn, and cotton. For more details, see the special chart in Huitong Finance Xiruo.
One chart for commodities support and resistance: gold, silver, oil, gas + platinum, palladium, copper + agricultural futures, updated at 12:00 (UTC+8), Tuesday, October 6, 2026, covering 14 products including gold, silver, platinum, palladium, copper + crude oil, natural gas, fuel oil + wheat, corn, and cotton. For more details, see the special chart in Huitong Finance Xiruo.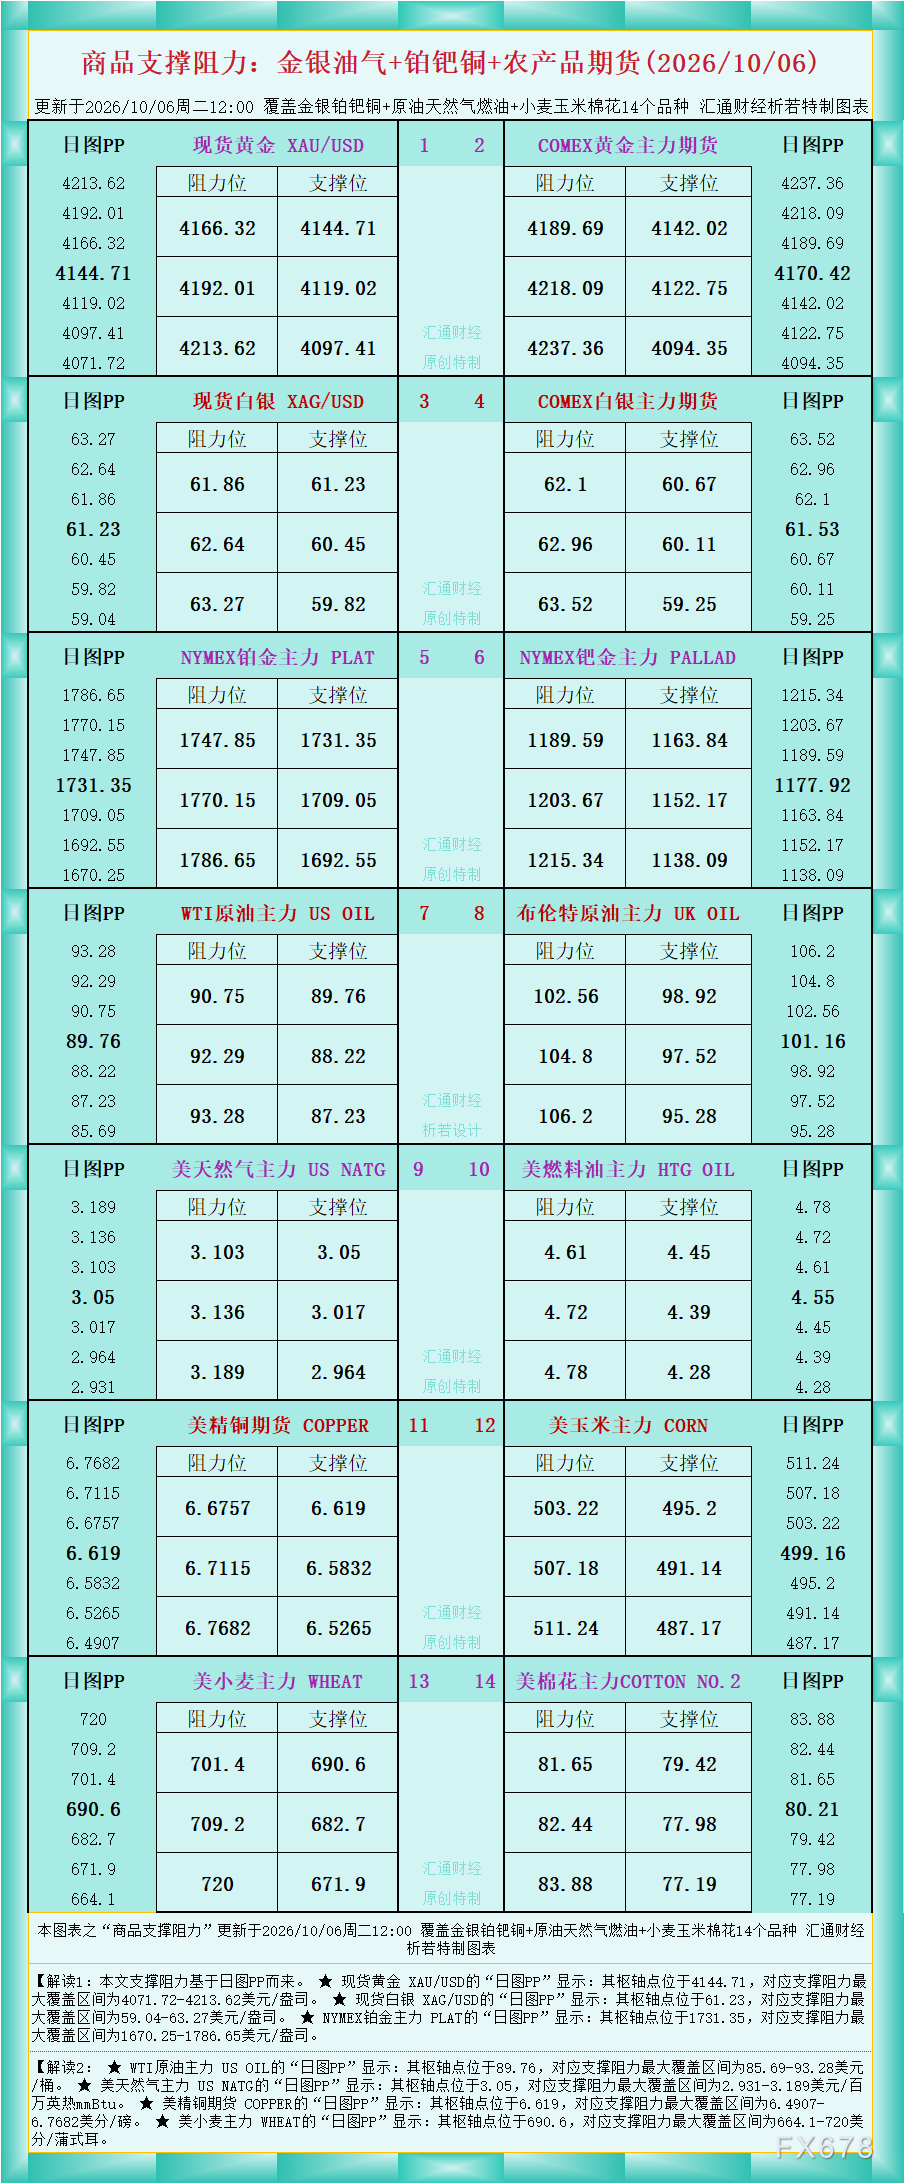
According to the data shown in the chart, Interpretation 1: The support and resistance levels in this article are based on daily PP charts.
★ Spot gold XAU/USD “daily PP” shows: the pivot point is at 4144.71, with the maximum support and resistance range at $4,071.72–4,213.62/oz.
★ Spot silver XAG/USD “daily PP” shows: the pivot point is at 61.23, with the maximum support and resistance range at $59.04–63.27/oz.
★ NYMEX platinum main contract PLAT “daily PP” shows: the pivot point is at 1,731.35, with the maximum support and resistance range at $1,670.25–1,786.65/oz.
Interpretation 2:
★ WTI crude oil main contract US OIL “daily PP” shows: the pivot point is at 89.76, with the maximum support and resistance range at $85.69–93.28/barrel.
★ US natural gas main contract US NATG “daily PP” shows: the pivot point is at 3.05, with the maximum support and resistance range at $2.931–3.189/million British thermal units (mmBtu).
★ US copper futures COPPER “daily PP” shows: the pivot point is at 6.619, with the maximum support and resistance range at 6.4907–6.7682 cents/pound.
★ US wheat main contract WHEAT “daily PP” shows: the pivot point is at 690.6, with the maximum support and resistance range at 664.1–720 cents/bushel.
For more product analysis, please refer to the chart.
Disclaimer: The content of this article solely reflects the author's opinion and does not represent the platform in any capacity. This article is not intended to serve as a reference for making investment decisions.
You may also like
BoJ may indicate underlying inflation is near the 2% target, sources say
Gold prices continue to fall as HSBC casts doubts and predicts further decline

Jeff Kilburg Backs 2 Tech Picks Even When They Trade Above Analyst Targets
Citigroup: Japanese bond yields may have reached their peak, clearer fiscal outlook will enhance investment appeal
Citigroup strategists believe that Japanese government bond yields may be approaching their peak, and they expect financial institutions to increase investments in Japanese bonds as the country's fiscal policy outlook becomes clearer.
Crypto prices
More


