Bitget App
Trade smarter
Buy cryptoMarketsTradeFuturesStocksEarnInstitutionAI & More
Academician in the crypto world: The lower shadow of bitcoin (BTC) on October 10 is not the bottom, and the upper shadow is not the top. The most honest market truth is hidden in the language of the candlestick chart.

Academician in the crypto world: The lower shadow of bitcoin (BTC) on October 10 is not the bottom, and the upper shadow is not the top. The most honest market truth is hidden in the language of the candlestick chart.

AiCoinAiCoin2026/10/09 16:01
Show original

Academician of the Crypto Circle: On 10.10, the lower shadow of Bitcoin (BTC) is not the bottom, and the upper shadow is not the top. The K line language hides the most honest market truth.

Currently, Bitcoin is priced at 83,000. To say its price is volatile would be an understatement. This morning, it dipped as low as 81,500, making many people nervous and wondering if a big drop was coming. However, in the afternoon, it steadily pulled back to around 82,900. A swing of nearly 2,000 dollars within a day is hard for those with weak hearts to handle. Actually, this kind of movement is very typical—a period of consolidation and adjustment after a strong rally. From over 57,000 in June to over 82,000 now, Bitcoin has gained nearly 25,000 dollars. It's perfectly normal to take a break and digest some profits along the way.
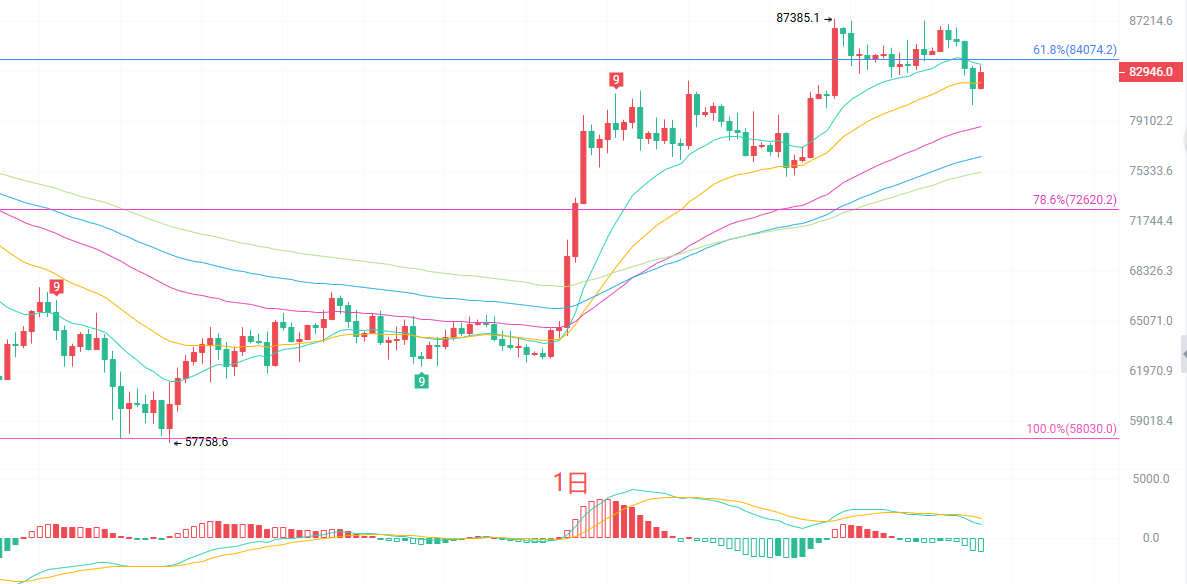
Academician in the crypto world: The lower shadow of bitcoin (BTC) on October 10 is not the bottom, and the upper shadow is not the top. The most honest market truth is hidden in the language of the candlestick chart. image 0

The daily K line bottomed out near 81,571 before rebounding, just above the lower Bollinger Band at 81,498, indicating that there is buying interest near the lower band. In the moving average system, the price is now above the EMA30 and EMA60, but it is being suppressed by the EMA15, and the short-term moving averages are starting to level off and turn. On the MACD, both DIF and DEA are above the zero axis, showing that the overall trend is still bullish, and the current movement is a normal pullback within an uptrend. The Bollinger Bands are narrowing, and the distance between the upper and lower bands is shrinking, signaling an upcoming breakout in either direction.
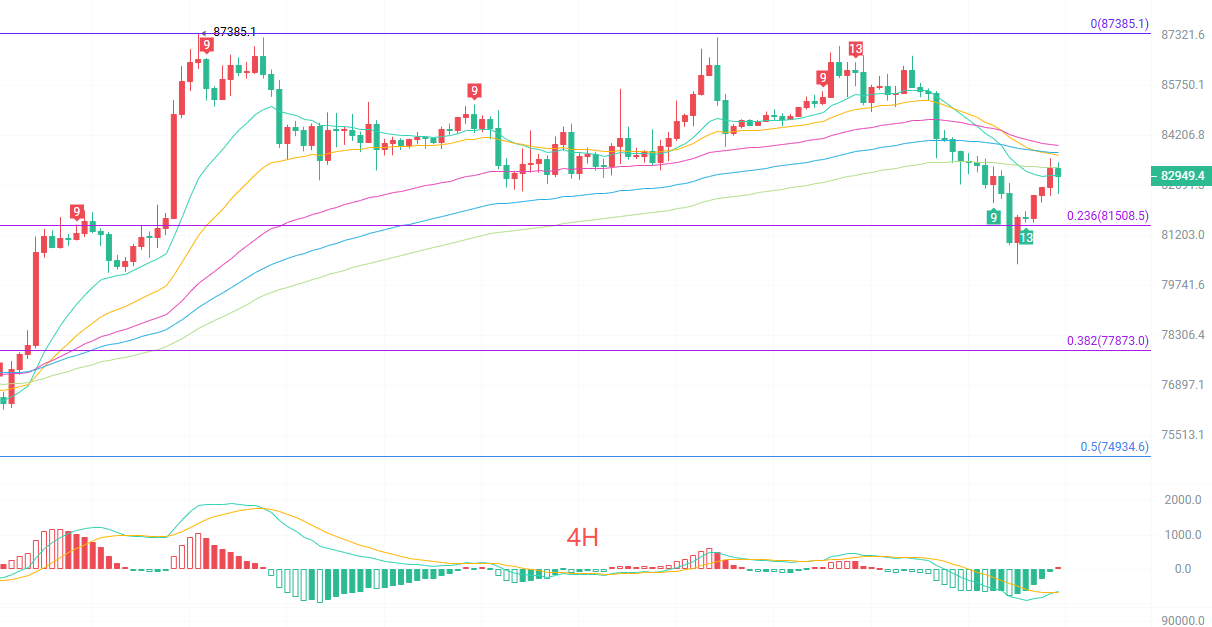
Academician in the crypto world: The lower shadow of bitcoin (BTC) on October 10 is not the bottom, and the upper shadow is not the top. The most honest market truth is hidden in the language of the candlestick chart. image 1

On the four-hour K line, after retreating from the previous high of 87,385 to a low of 74,909, Bitcoin has rebounded all the way and is now consolidating in the 82,000 to 83,500 range. Regarding moving averages, EMA15 is at 82,983; the EMA30 and EMA60 are suppressing the short-term price, but EMA120 is flattening out around 83,241, potentially forming support. The MACD indicator is showing signals of a short-term rebound. The lower Bollinger Band at 80,666 is a key support level, while the middle band at 83,431 is the first resistance level above.

Short-term reference

Long: Support holds at 81,700 to 81,200, stop loss at 500 points, target at 83,500 to 85,000

Short: Price stagnates at 83,500 to 84,000, stop loss at 500 points, target at 82,500 to 81,500

For specific trades, please rely mainly on real-time order book data. For more detailed information and analysis, feel free to contact the author. There is a delay in article publishing, so this is for reference only and trading is at your own risk.

Academician in the crypto world: The lower shadow of bitcoin (BTC) on October 10 is not the bottom, and the upper shadow is not the top. The most honest market truth is hidden in the language of the candlestick chart. image 2
News Image 0News Image 1News Image 2
0
0

Disclaimer: The content of this article solely reflects the author's opinion and does not represent the platform in any capacity. This article is not intended to serve as a reference for making investment decisions.

Understand the market, then trade.
Bitget offers one-stop trading for cryptocurrencies, stocks, and gold.
Trade now!

You may also like

Update: Equities Rise Intraday as Traders Parse Consumer Sentiment Survey

01:37 PM EDT, 10/09/2026 (MT Newswires) -- (Updates with latest market prices and developments.) US benchmark equity indexes were higher intraday as investors evaluated a survey on consumer sentiment. The Dow Jones Industrial Average was up 0.8% at 51,628.8 after midday Friday, while the Nasdaq Composite and the S&P 500 rose 0.6% each to 27,352.4 and 7,809.5, respectively. Barring communication services, all sectors were in the green, led by real estate. US consumer sentiment fell in October as the one- and five-year inflation expectations reached their highest levels since May, preliminary results of a University of Michigan survey showed Friday. "While year-ahead expectations for personal finances and business conditions crept up slightly, buying conditions for durables plummeted amid high prices and borrowing costs," Surveys of Consumers Director Joanne Hsu said. "Frustration over cost-of-living continues to mount, as consumers across the political spectrum believe that the trajectory of the economy has weakened since the beginning of the year." Markets are currently pricing in a nearly 81% probability that the Federal Reserve will keep its benchmark rate steady later this month, with the remaining odds in favor of a second consecutive 25-basis-point hike, as the central bank looks to tame inflation, according to the CME FedWatch tool. West Texas Intermediate crude was down 0.4% at $91.17 a barrel intraday, while Brent lost 0.5% to $103.81. The 10-year US Treasury yield was up 1.5 basis points at 5.25%, while the two-year rate increased 3.9 basis points to 4.8%. In company news, SpaceX (SPCX) shares were up 0.5%. The rocket and satellite company said late Thursday it agreed to acquire a nationwide low-band spectrum portfolio from investment firm Grain Management as it seeks to establish Starlink Mobile as a major US mobile carrier. T-Mobile US (TMUS) shares sank 13% intraday Friday, the worst performer on the S&P 500, followed by AT&T (T) and Verizon Communications (VZ), which fell 10% and 9.8%, respectively.

MT newswire•2026/10/09 17:37

Ameren declares quarterly dividend of $0.75 a share

Ameren declared a quarterly cash dividend of 75 cents per common share. Dividend payable Dec. 31, 2026. Shareholders of record as of Dec. 8, 2026 will receive the dividend. Disclaimer: This news brief was created by Public Technologies (PUBT) using generative artificial intelligence. While PUBT strives to provide accurate and timely information, this AI-generated content is for informational purposes only and should not be interpreted as financial, investment, or legal advice. Ameren Corporation published the original content used to generate this news brief via PR Newswire (Ref. ID: 202610091331PR_NEWS_USPR_____CG68019) on October 09, 2026, and is solely responsible for the information contained therein.

Bitget•2026/10/09 17:32