Good evening everyone, I’m Xinya. Let’s briefly review the past two days’ price action. There’s really nothing particularly noteworthy—Bitcoin’s price has mainly fluctuated between 80,500 and 79,500, absorbing and consolidating in this range. Each time the price touches either side, there is a reaction from the market. Note that during the night session on the 26th, Bitcoin rebounded three times around 79,800. However, after the level broke during the daytime session, price rebounds to this area were blocked three times.
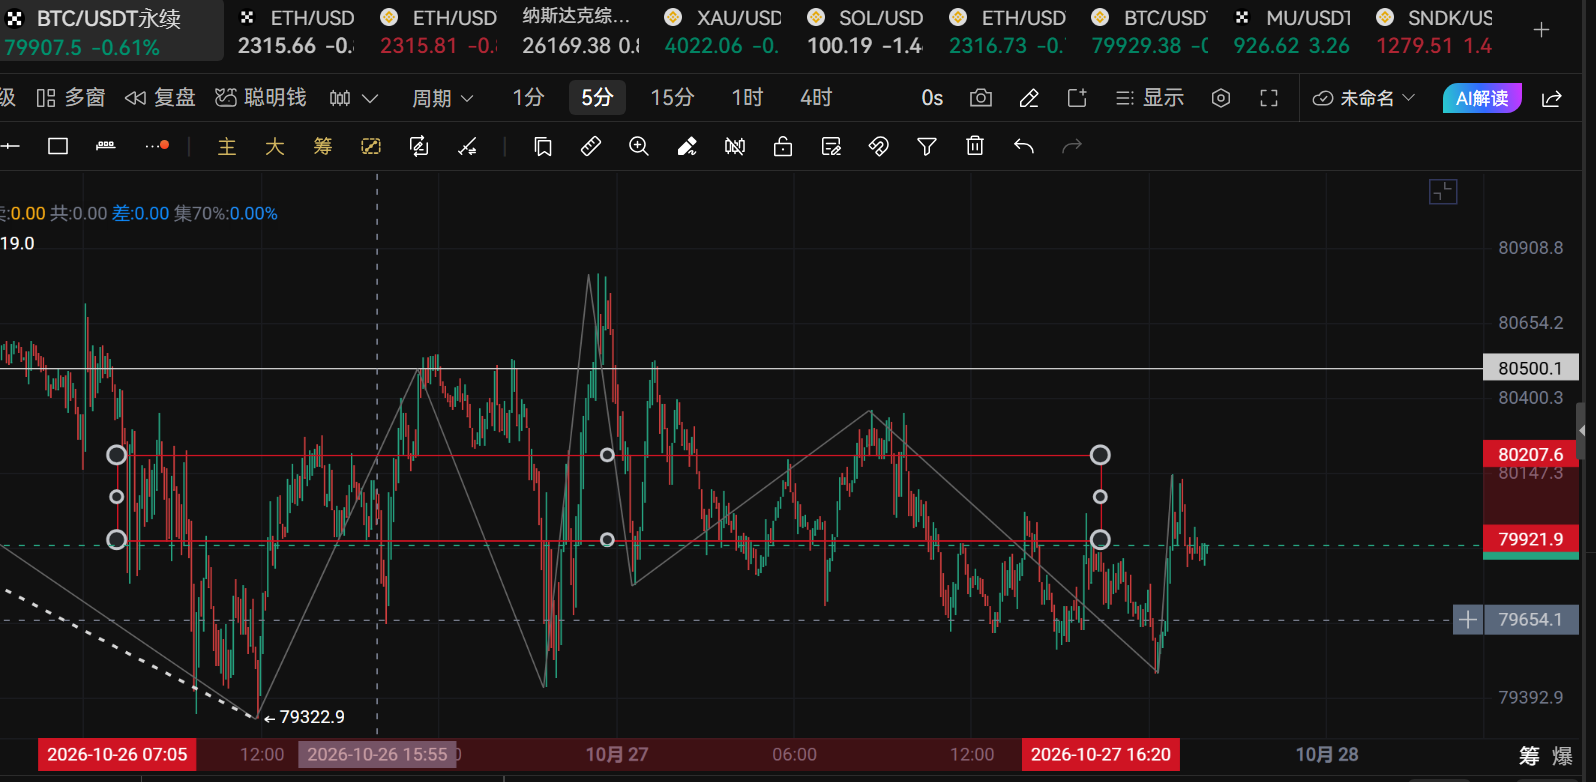
We need to mark these three levels as key, as they are important points of divergence in the market. Over the past two days, the market has moved back and forth near the 79,920–80,200 area twenty-five times. The broader consolidation range of 79,400–80,800 is a symmetric extension of this area. Why specifically 280 points? Is the main force playing with numerology? In classical philosophy, 50 is the great way, Heaven reveals 49, leaving one hidden. Return cycles happen every seven days, with 280 marking the completion of a cycle. When the time comes, things change.
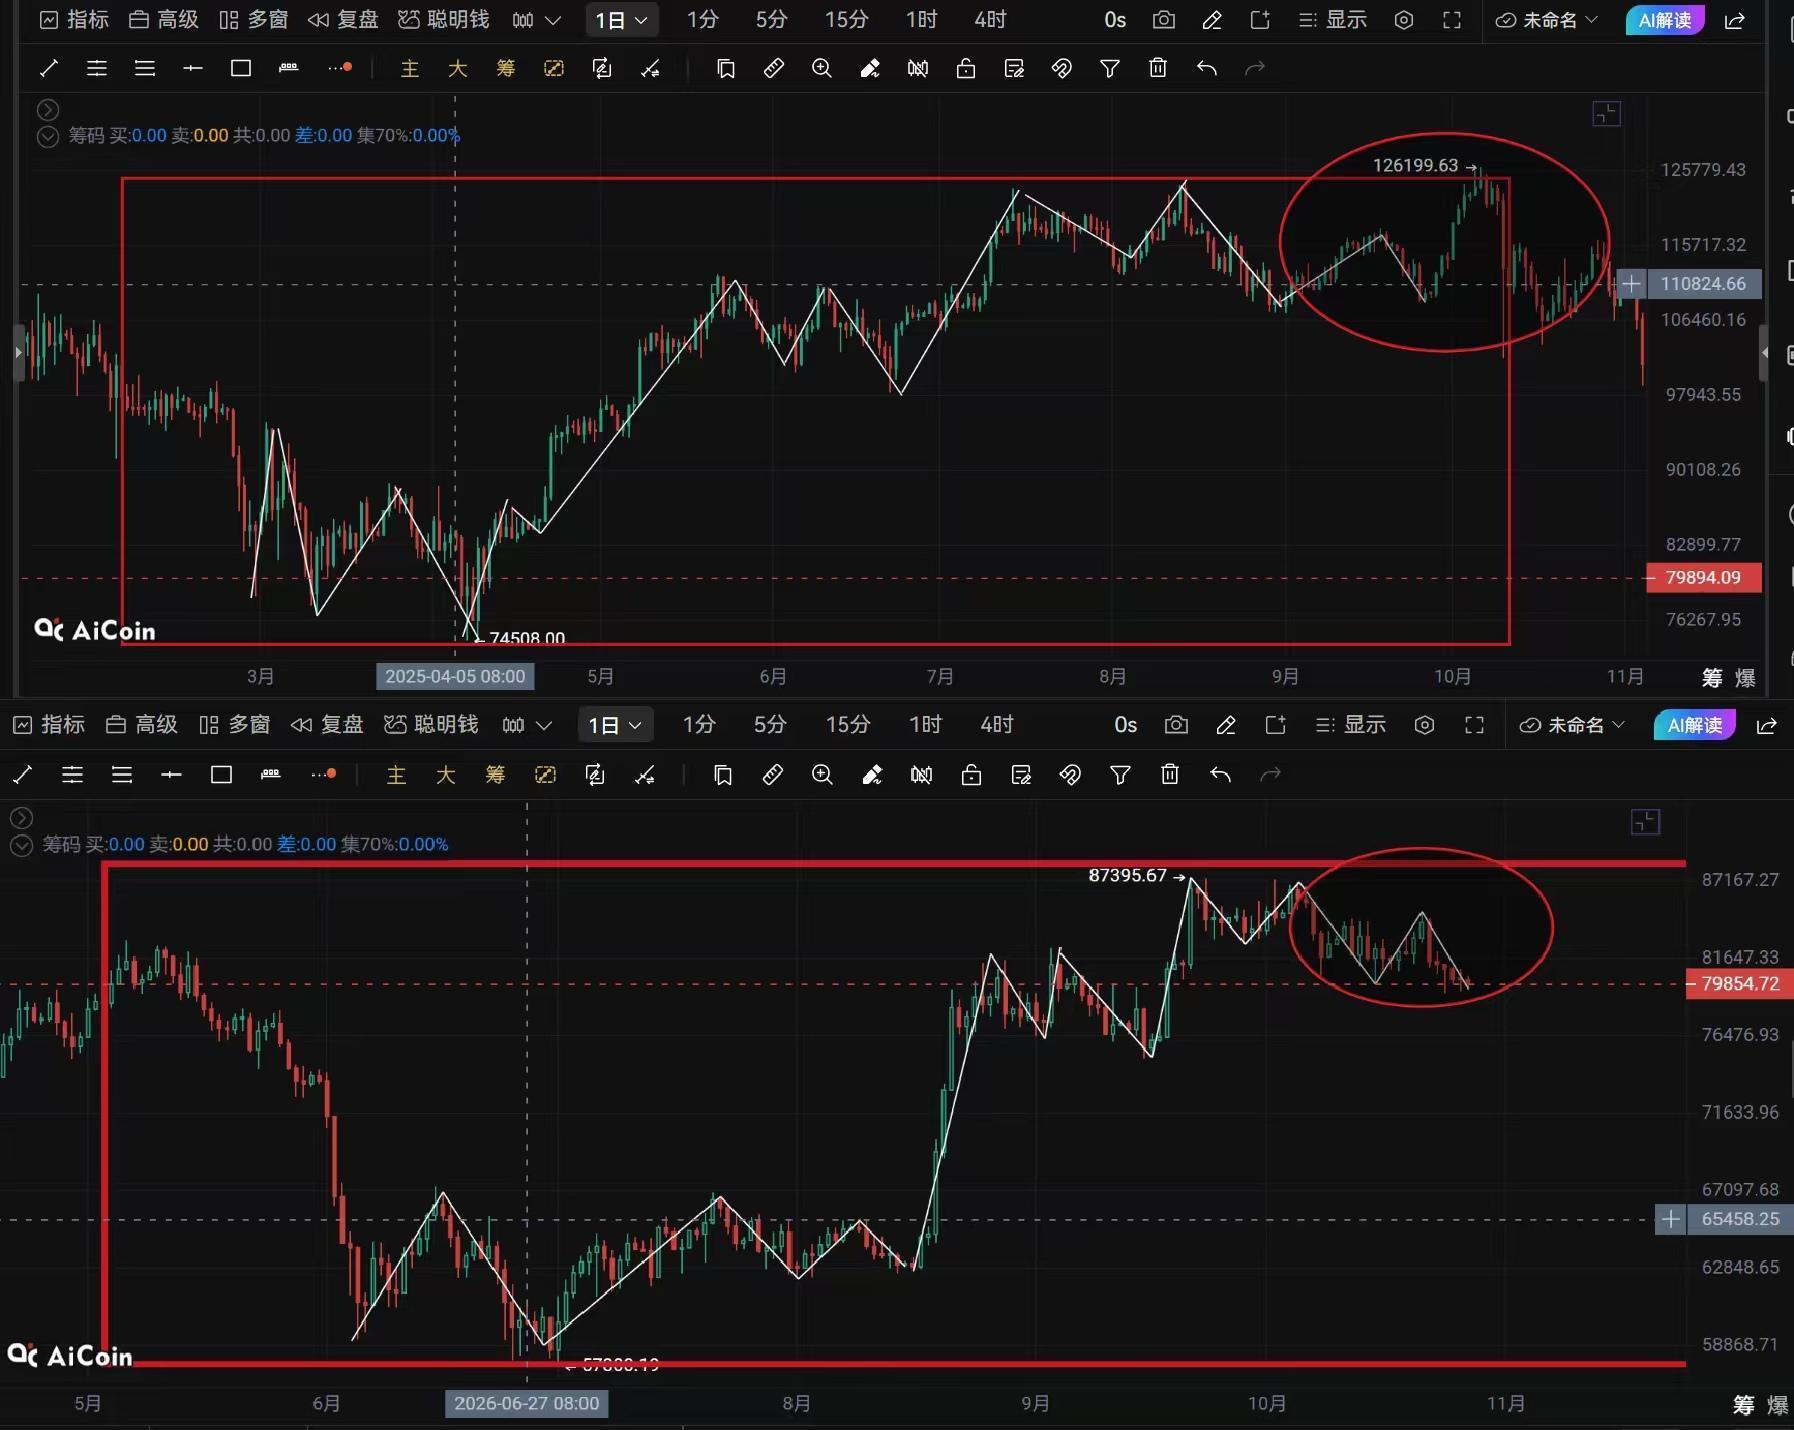
We refer to the most similar box pattern in the current structure—March to October 2025. Back then a bearish candle appeared, followed by seven days of decline before a small reversal. This time, the drop lasted six days and the month is ending soon. On October 30th, 1.08 billion options expire, with the maximum pain point at 78,000. It’s possible recent market weakness is influenced by pessimistic sentiment, and options expiration is also playing a part.
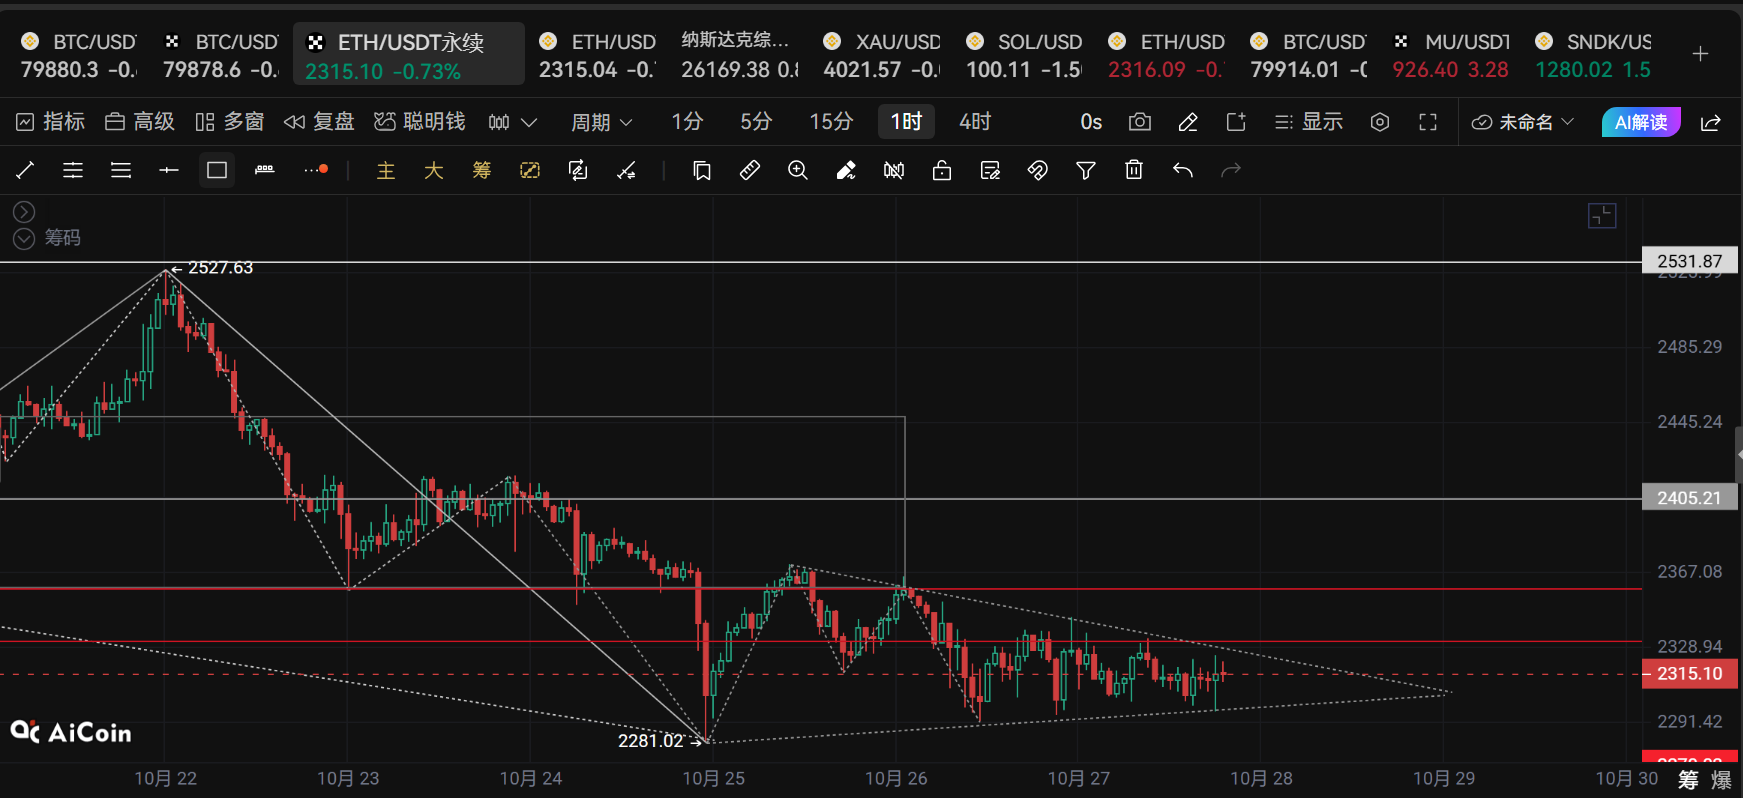
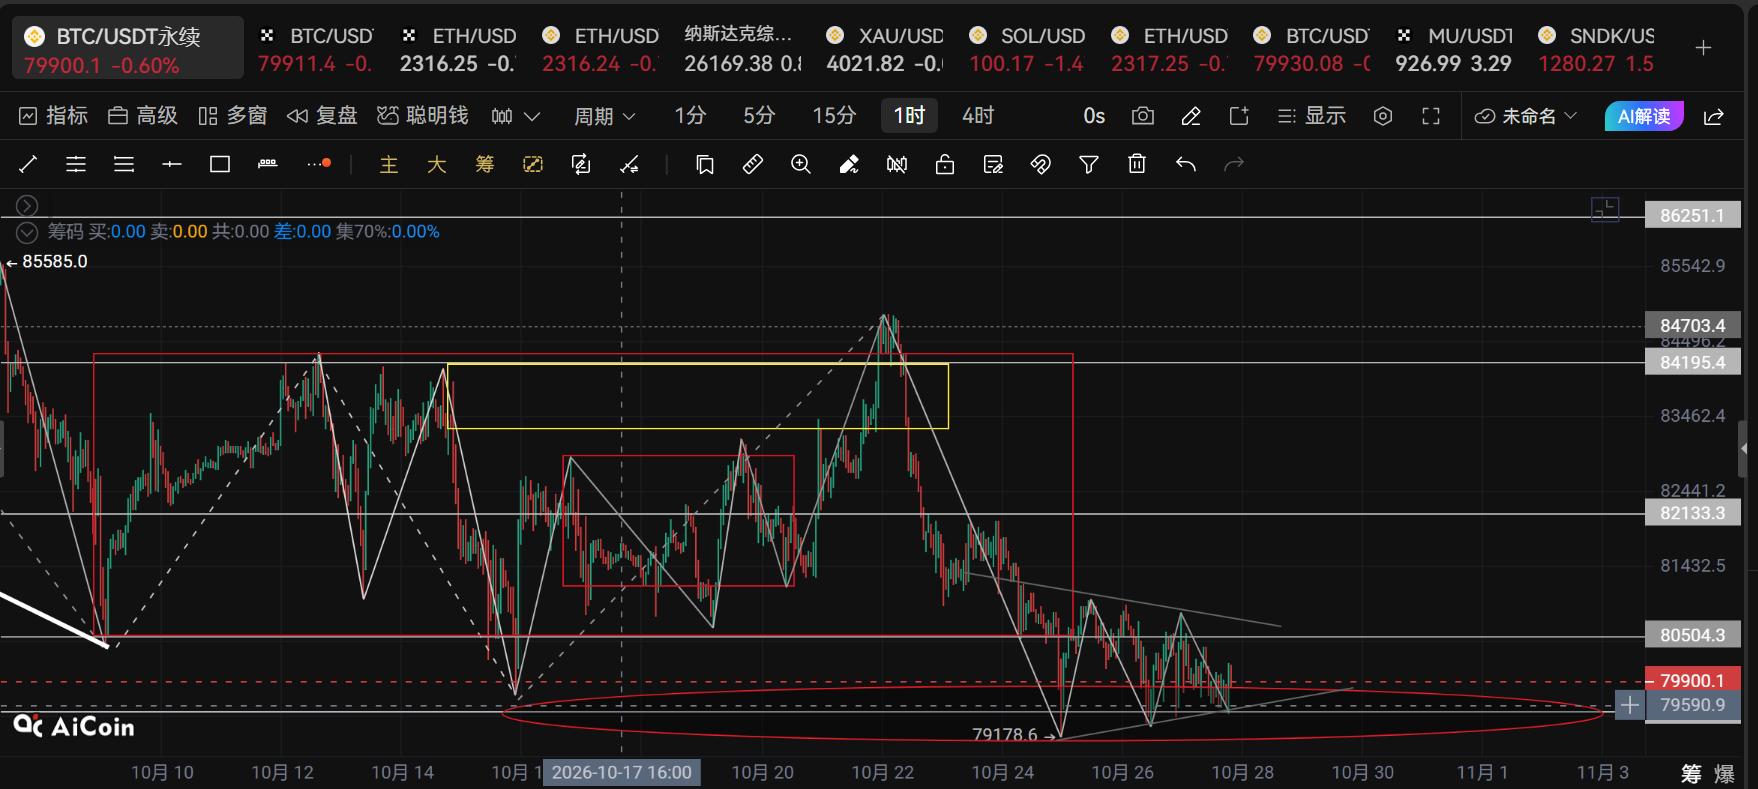
Structurally, Ethereum is forming an hourly triangle consolidation with multiple 15-minute patterns, while Bitcoin has a wedge formation. Those betting on shorts will subjectively assume Bitcoin is forming a falling wedge and view Ethereum as running a four-hour slant-head top; this is how they convince themselves. We treat them as counterparties. The current price has already shown four-hour bullish divergence, and a weak recovery in the wedge is underway.
Today’s strategy is a slight adjustment based on yesterday’s plan; according to our average price:
Bitcoin: long at 79,500, add at 78,800, stop at 78,200
Ethereum: long at 2,300, add at 2,380, stop at 2,358
Over the next week, test levels at 81,200, 82,200, and 83,200 in sequence
For Ethereum: 2,360, 2,405, 2,450
The center of the consolidation is moving up, with the range at 79,500–81,200 for Bitcoin, and 2,295–2,355 for Ethereum. Have confidence in the recovery trend.