
Google (Alphabet) Q3 2026 Earnings: Stock Plunges 9% After Hours! Revenue Hits $127.6 Billion, Up 25% YoY but Misses Expectations; Cloud Business More Than Doubles, but Cash Burn Begins as AI Investment Returns Come Under Scrutiny
 2026/10/29 02:46
Core Takeaways
Google’s third quarter (July–September 2026) revenue reached about $127.6 billion, up 25% from a year earlier. This marks the 13th straight quarter of double-digit growth and puts the company on a roughly half-trillion-dollar annual revenue run rate. However, the result came in slightly below analysts’ expectations of around $128.2 billion.
Profitability was weaker. Net income was about $26.17 billion, down roughly 25% year-over-year, with GAAP EPS of $2.12 (adjusted EPS around $2.67). Both missed expectations, largely because of an approximately $8.7 billion loss on equity investments (after a big gain in the prior quarter). Operating income was about $40.6 billion, up 30%, with an operating margin of 31.8%.
The standout was Google Cloud, where revenue more than doubled (+103%). Search and advertising growth slowed and missed expectations. More importantly, free cash flow was negative for the second straight quarter as the company spent heavily on AI and data centers. Shares fell 8–10% in after-hours trading as investors questioned how soon the large AI investments will generate real returns.
Detailed Breakdown
1. Overall Revenue and Profit Performance
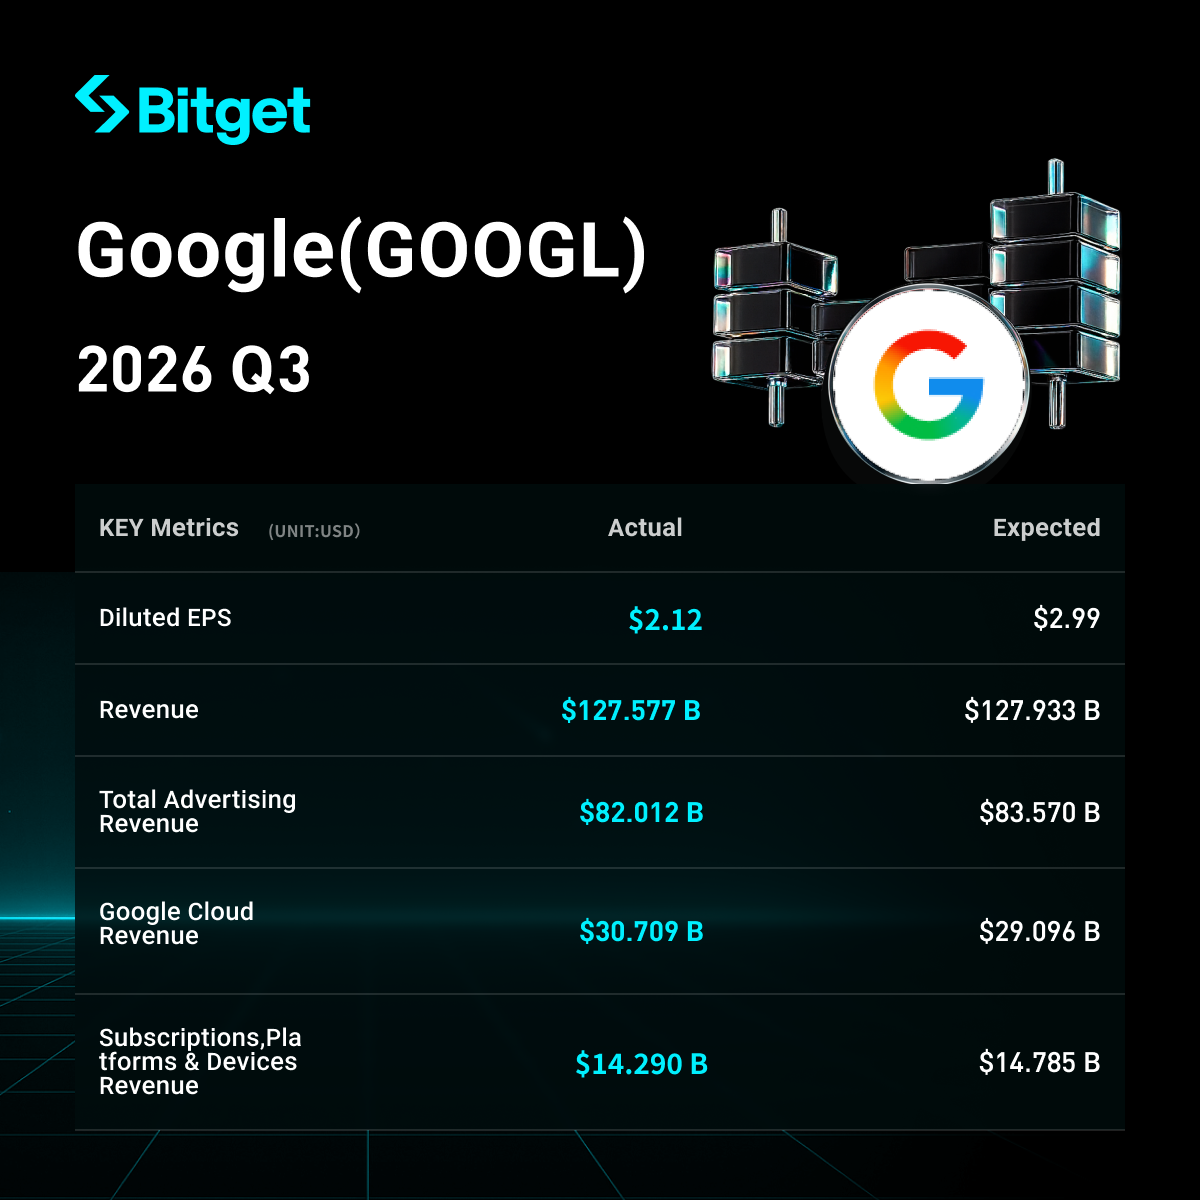
- Total revenue: $127.577 billion (vs. $102.346 billion a year earlier), +25% YoY, but below the roughly $128.22 billion expected. This was the first top- and bottom-line miss in nearly four years.
- Net income: $26.17 billion (down about 25% YoY); GAAP EPS $2.12 (vs. $2.87 a year earlier). Excluding the equity investment loss, adjusted EPS was about $2.67, still short of the roughly $3.02 expected.
- Operating income: $40.576 billion, +30% YoY; operating margin 31.8% (slightly higher than last year).
- Operating cash flow: $42.29 billion, down about 13% YoY.
- Free cash flow: negative $9.065 billion (second consecutive negative quarter). Trailing-twelve-month free cash flow was about $19.7 billion, down roughly 73% YoY.
- Other notes: Employee count rose to about 204,757 (+ nearly 8% YoY). R&D expenses grew 36%. Spending increased faster than revenue.
2. Google Cloud Performance
- Revenue: $30.709 billion, +103% YoY (more than doubled), well above expectations.
- Operating income: $11.121 billion; operating margin expanded sharply to 36.2% from 23.7% a year earlier.
- Drivers: Strong enterprise demand for AI infrastructure and cloud services (including multi-year deals in cybersecurity, retail, and financial services), plus meaningful contribution from TPU system sales. Google Cloud continues to gain share from AWS and Azure. Backlog remains very large.
3. Other Business Segments
- Google Services total revenue: $96.302 billion, +11% YoY, below expectations.
- Search & other: $63.350 billion, +12% YoY (missed expectations and slowed from ~17% growth in the prior quarter). The company said search query growth was the fastest in five years, supported by AI.
- YouTube ads: $11.207 billion, + about 9% YoY (below expectations). YouTube Music and Premium subscribers (including trials) exceeded 150 million.
- Total advertising revenue: about $82.012 billion, +11% YoY, below expectations.
- Subscriptions, platforms, and devices: about $14.29 billion, +11% YoY.
- Other Bets remained small with a wider operating loss.
4. Capital Expenditure Plans (Heavy Investment in AI and Data Centers)
- Q3 capital expenditures: $51.355 billion, +114% YoY (vs. about $24 billion a year earlier), mainly for data centers, servers, and networking equipment.
- Full-year 2026 CapEx guidance: maintained at $195–205 billion (already raised earlier), implying full-year spending above $200 billion.
- 2027 outlook: Management expects CapEx to “increase significantly”; the market generally anticipates more than $300 billion.
- In short, AI infrastructure spending is outpacing operating cash flow, resulting in negative free cash flow.
| Capital expenditures | ~$51.4 billion | +114% |
| Free cash flow | Negative ~$9.1B | Turned negative |
5. Next-Quarter Outlook
The company did not provide specific numerical revenue guidance for Q4. Management noted a potential modest FX headwind and the impact of lapping stronger search growth from a year ago. It is also beginning to use some third-party cloud capacity, which could pressure margins in the near term. Full-year CapEx guidance is unchanged. The CEO highlighted AI progress, including the Gemini app reaching 1 billion monthly active users—the fastest-growing product in company history.
6. Market Context and Investor Concerns
The core tension is clear: Cloud and AI demand are very strong, with excellent growth and expanding margins, but traditional search and advertising growth has slowed and may be facing some internal substitution from AI. At the same time, free cash flow has been negative for two consecutive quarters amid massive AI spending. Investors are asking when these investments will translate into higher profits and cash flow.
As a result, shares dropped 8–10% after hours, giving back a significant portion of recent gains. The market is now more focused on the speed of returns on AI investment than on revenue growth alone.
Disclaimer:
This content is for reference only and does not constitute investment advice. Data is primarily based on the company’s official earnings release and related reports. Figures are intended to be accurate, though analyst expectations can vary slightly by source.
Disclaimer: The content of this article solely reflects the author's opinion and does not represent the platform in any capacity. This article is not intended to serve as a reference for making investment decisions.
You may also like
SanDisk Q1 Revenue Soared Nearly 4x Year-Over-Year, Q2 Revenue Guidance Exceeds Expectations Again, Data Centers Remain the Core Growth Driver for Next Year | Earnings Report Insights
SanDisk released its financial report for the first quarter of fiscal year 2027, with revenue reaching $11.031 billion, a year-on-year increase of 378%. Among this, revenue from the data center business in the first quarter was $4.8 billion, up 61% quarter-on-quarter and 1682% year-on-year, significantly outpacing overall revenue growth. Management expects that in calendar year 2027, the data center segment will remain the core driver of growth in the NAND market, accounting for over 55% of the market share. Revenue for the second quarter is projected to be between $12.2 billion and $12.6 billion, exceeding analysts' expectation of $12.1 billion.
Best Crypto to Buy Now: BTC Holds Near $80K After Hawkish Fed, Zcash Keeps Its Top-10 Spot

Crypto prices
More


