
Bitcoin's "Election Effect": Political Catalyst or Just Coinciding with the Halving Cycle?

All one-year returns across three complete cycles are positive, but each experienced a further decline first.
Written by: IOSG Ventures
Since 1950, there have been a total of 19 midterm elections in the United States. According to our statistics, every time, the S&P 500 index was higher one year after the voting day. Bitcoin has experienced three complete midterm election cycles, and its price was also higher a year later each time, but for several weeks after each vote, it dipped further first.
On the voting day this November 3rd, the two markets are positioned differently. US equities are near all-time highs, while bitcoin is still recovering from the previous steep sell-off. Historically, one may be optimistic about the returns for both a year later, but their price paths in the interim could be quite different.
However, how much reference value these historical data points provide for 2026 remains uncertain. In past years before midterm elections, the median maximum drawdown in US stocks was 16%, but this year it's only about 9%, so there wasn’t much ground to recover. Bitcoin only has three data points, and each midterm election happened about two to two and a half years after a halving event, meaning the two cycles overlapped, making it difficult to determine how much the rally and the election are actually related.
Key Points
- US stocks: Historically, post-midterm election performance has been quite strong, but pre-election performance this year is also stronger than in previous years. Thus, it is not prudent to simply assume the average historical rally will repeat itself.
- Bitcoin: All three complete cycles delivered positive one-year returns, but each experienced a further drop first. With only three samples, it is not possible to confirm the existence of a reliable “election effect.”
- Policy: Congressional control will affect the crypto industry’s legislation and regulation. However, the core drivers of market direction remain corporate earnings, interest rates, and capital flows.
US Stocks: Strong Historical Performance, but Starting Point Differs This Year
From 1950 to 2022, there were 19 midterm elections. In the 12 months after each election, the S&P 500 index was up, with an average gain of 15.1% and a median of 14.5%. Even the weakest year saw a 1.1% increase.
In contrast, in non-midterm years, if we also start from early November, the average return for the following year was 7.2%, with about 70% of samples showing gains.

▲ Source: IOSG, calculated based on daily closing prices
Historically, market declines mostly occurred before the election. In the year before the midterms, the median maximum drawdown was 16%. Within a six-month window around the voting day, as defined by this study, in 17 out of 19 elections, the market lows occurred before election day.
Importantly, the rally doesn’t always wait for the votes to be counted. According to BlackRock’s analysis, as election results become clearer, the US stock market typically starts rallying about a month ahead of the midterms. In late October this year, prediction markets gave the Democratic Party about a 93% chance of controlling the House and a 68% chance in the Senate. This means a split government, with the president and Congress from different parties, has already been widely anticipated by the market and is unlikely to be a surprise on election day.
This does not mean all policy effects are priced in, but a result in line with expectations may trigger a smaller immediate market reaction compared to an unexpected outcome. Therefore, the voting day can be used as a reference point for observing market behavior, though it may not be an inflection point for trends.
The starting point for this year’s market is also different. In late October, the S&P 500 index was just about 3% below the all-time closing high set on October 6, and the max drawdown over the past year was about 9%. In other words, there isn't much of a gap left to recover.
Historically, there were five midterm elections that met both conditions: a pre-election rally of over 10% and a drawdown of less than 10%. These occurred in 1954, 1958, 1986, 2006, and 2014. One-year returns following these ranged from 1.1% to 33.2%, with a median of 6.7%.
Rather than the seemingly precise median, this wide range deserves more attention. These cases show that a strong market before the election may continue to rise afterwards, but this does not provide a reliable basis for setting return targets for 2027.
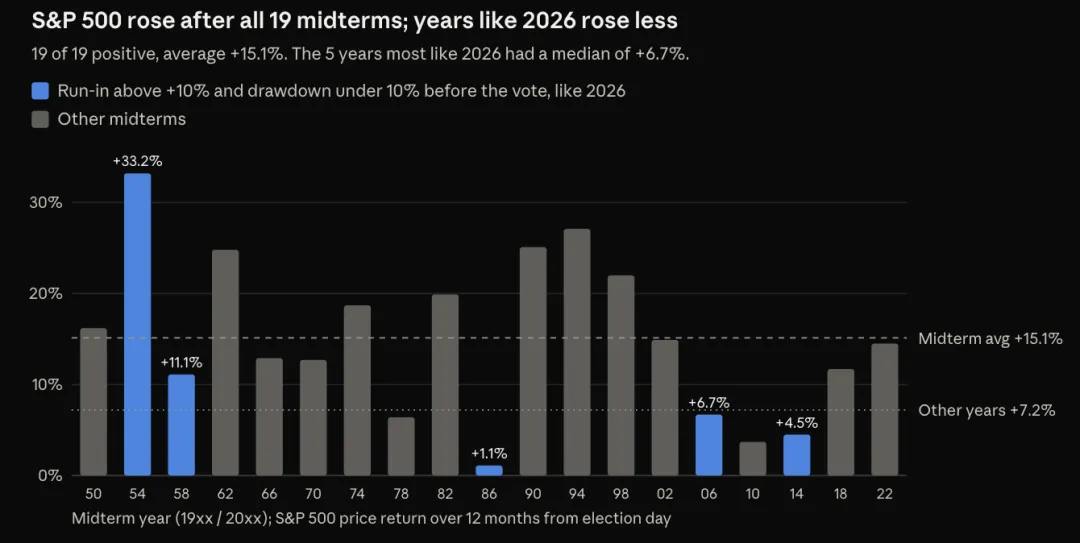
▲ Figure 1. S&P 500 index returns for 12 months after each midterm election. The blue bars highlight five historical cases marked by “large pre-election rallies and shallow drawdowns” for comparison with 2026.
Historical experience leans optimistic, but the next rally will still require support from corporate earnings and interest rate environments.
Bitcoin: Going Up After a Year Does Not Mean the Recovery Is Easy
Bitcoin’s history is shorter, and holding through drawdowns is tougher.
In the three complete midterm election cycles of 2014, 2018, and 2022, BTC dropped for several weeks after the voting day but was higher one year later each time. The decline in 2022 was shorter-lived, and BTC posted gains by three months post-election. The short-term performances across cycles varied greatly.
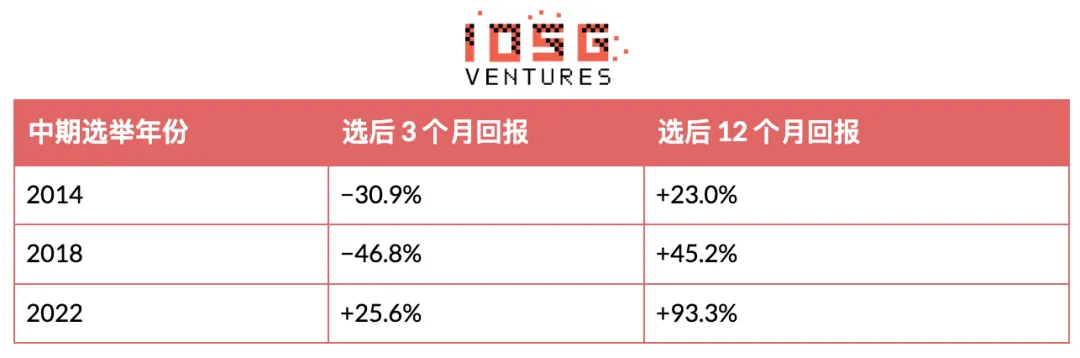
▲ IOSG, calculated using CoinMetrics BTC PriceUSD data
According to Binance Research, bitcoin's average one-year gain after the midterms is about 54%, consistent with our own sample average of 53.8%. But the path of recovery is equally important: the median three-month post-election return was about –31%, while the median twelve-month return was about +45%. Even investors who ultimately caught the direction of the recovery may face notable losses before the gains arrive.
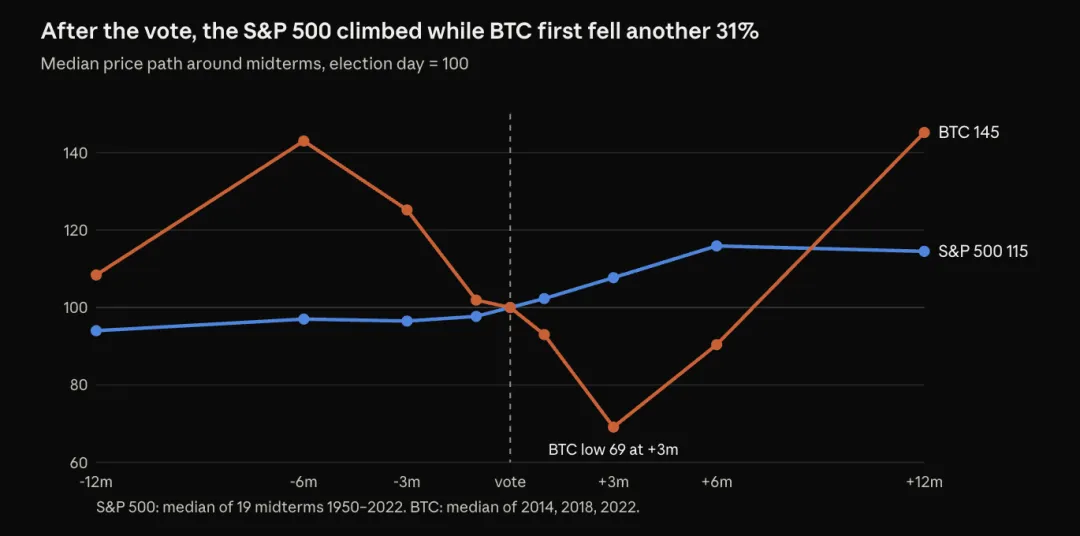
▲ Figure 2. Median performance around midterm elections, indexed to 100 at the voting day. The S&P 500 sample covers 19 elections from 1950–2022; the Bitcoin sample covers three elections from 2014–2022. The lines only connect selected observation points and do not represent forecasts.
However, these samples alone cannot identify the impact of the election itself. Each midterm also happens to fall about two to two and a half years after a bitcoin halving and during a bear market. The 2026 election will also come about two and a half years after the April 2024 halving.
Since there are only three samples, with overlapping cycles, it's impossible to say whether elections have a substantive impact on this pattern.
Likewise, the median curve shouldn’t be used as a price forecast. This line aggregates different years’ results, not what any investor actually experienced in a single market cycle. Mechanically applying it to today’s price would only create a false sense of precision the data does not support.
With spot ETFs and corporate treasury inflows, bitcoin’s investor base is changing. These channels can generate demand but may also introduce redemption pressure, refinancing risks, and shifts in risk appetite to the market.
What really matters is this: Being optimistic for the year ahead is not inconsistent with allowing for more downside in the near term. As for when the decline will end, history offers no clear answer.
What Changes Will Elections Bring to the Crypto Industry?
For the crypto industry, the most direct election impact comes from policy. Since the market broadly expects the President and Congress to be of different parties, what matters most is how the new Congress adjusts legislation, regulatory oversight, and personnel appointments in agencies.
The progress of the CLARITY Act is a case in point for such uncertainty. On September 15, the Senate failed to pass a procedural motion to end debate and advance the bill, with a vote of 49 to 50. Subsequently, the Senate filed a motion to reconsider, so the bill is technically stalled but not completely dead. However, the Senate did not hold a second vote before adjourning for the election, leaving only the “lame duck session” between the election and the next Congress as the last window of opportunity this term.
The next Congress will determine committee leadership, legislative priorities, and terms for renewed negotiations.

If the Republicans retain the Senate, it may be more favorable for policy proposals preferred by the industry, but that doesn't guarantee passage. Likewise, if the Democrats control Congress, it doesn't mean bipartisan cooperation is impossible.
At the same time, regulatory agencies can still act within their existing authority. Rulemaking and staff guidance might resolve some specific issues, but their scope and durability may not match that of formal legislation.
The same election result can affect US equities and the crypto industry in different ways. If the president and Congress are from different parties, new fiscal spending plans may be constrained, easing upward pressure on bond yields and supporting stock valuations. For crypto companies, however, legislative gridlock could prolong uncertainty around market structure rules.
This could result in divergent outcomes: financial markets might welcome restrained fiscal spending, while the crypto industry could be disappointed by ongoing lack of a stable legal framework. Of course, neither outcome is guaranteed; even if Congress is gridlocked, the executive branch and regulatory agencies may still push policy changes.
What Factors Can Support Markets Through to 2027?
My baseline view: US equities are generally optimistic, but the path will be choppy; bitcoin’s short-term direction is harder to call. This is a judgment made with historical context—not a direct forecast from past data.
For US stocks, sustained corporate earnings growth and reduced pressure from bond yields will aid further rallies. Broader participation beyond large tech names would make recovery more convincing. Conversely, regardless of which party controls Congress, persistently high inflation or disappointing earnings would undermine bullish arguments.
For bitcoin, I’ll watch whether spot ETFs can continue drawing capital, whether liquidity improves, and whether bitcoin can hold prior gains in a weaker market. If outflows persist or financing pressure rises again, it’s premature to assume the bear-market low is behind us.
Three changes in particular are worth watching:
- The December 8–9 FOMC meeting: On October 28, the Federal Reserve kept rates at 3.75%–4.00%, with two dissenting votes, and the market is now factoring in the possibility of a December rate hike. New economic forecasts will help assess whether pressure from bond yields is easing.
- Earnings and breadth of gains: Whether earnings growth and price rallies spread beyond current index leaders to more firms.
- Bitcoin capital flows: Whether institutional demand can persist for several weeks, rather than show up in just a few trading days.
Election results should be observed alongside these indicators, not in isolation.
Conclusion
The strongest finding in the historical data is the remarkable consistency of S&P 500 rallies after midterm elections. However, it’s crucial to note that equities are already coming into the 2026 vote quite strong.
Bitcoin tells a different story: across three cycles, the price was higher a year later, but investors faced further drawdowns. This helps understand holding risks but is insufficient to support clear forecasts for the next cycle.
The November 3 election will influence the future policy environment. Whether the market’s recovery persists into 2027 will ultimately depend on subsequent corporate earnings, liquidity, and capital flows.
Historical tables and charts: IOSG calculations using Yahoo Finance S&P 500 daily close (^GSPC, excluding dividends) and CoinMetrics BTC PriceUSD data.
Disclaimer: The content of this article solely reflects the author's opinion and does not represent the platform in any capacity. This article is not intended to serve as a reference for making investment decisions.
You may also like
3 Cryptos Attracting Massive Attention: HBAR, BCH, SUI
Democratic wave sweeps Congress, why is Wall Street going long?
Goldman Sachs and Deutsche Bank believe that the concentrated closing of pre-election hedging positions is driving the rebound, and the compression of risk premiums is supporting short-term market conditions. However, the freeze on data center construction in Texas, the investment prospects for AI, and the debt ceiling crisis in Q2 next year remain core risks. The real policy test for the market will begin after the new Congress takes office in January next year.

Crypto prices
More


