
A chart of commodity support and resistance levels: gold, silver, oil, gas, platinum, palladium, copper, and agricultural futures (November 9, 2026)

Huitong Network, November 9—— One chart to view commodity support and resistance: gold, silver, oil & gas + platinum, palladium, copper + agricultural futures. Updated on Monday, November 9, 2026, at 09:30 (UTC+8). Specifically covers 14 varieties including gold, silver, platinum, palladium, copper + crude oil, natural gas, fuel oil + wheat, corn, cotton. For more details, please refer to the custom charts by Huitong Finance Analyst Rote.
One chart to view commodity support and resistance: gold, silver, oil & gas + platinum, palladium, copper + agricultural futures. Updated on Monday, November 9, 2026, at 09:30 (UTC+8). Specifically covers 14 varieties including gold, silver, platinum, palladium, copper + crude oil, natural gas, fuel oil + wheat, corn, cotton. For more details, please refer to the custom charts by Huitong Finance Analyst Rote.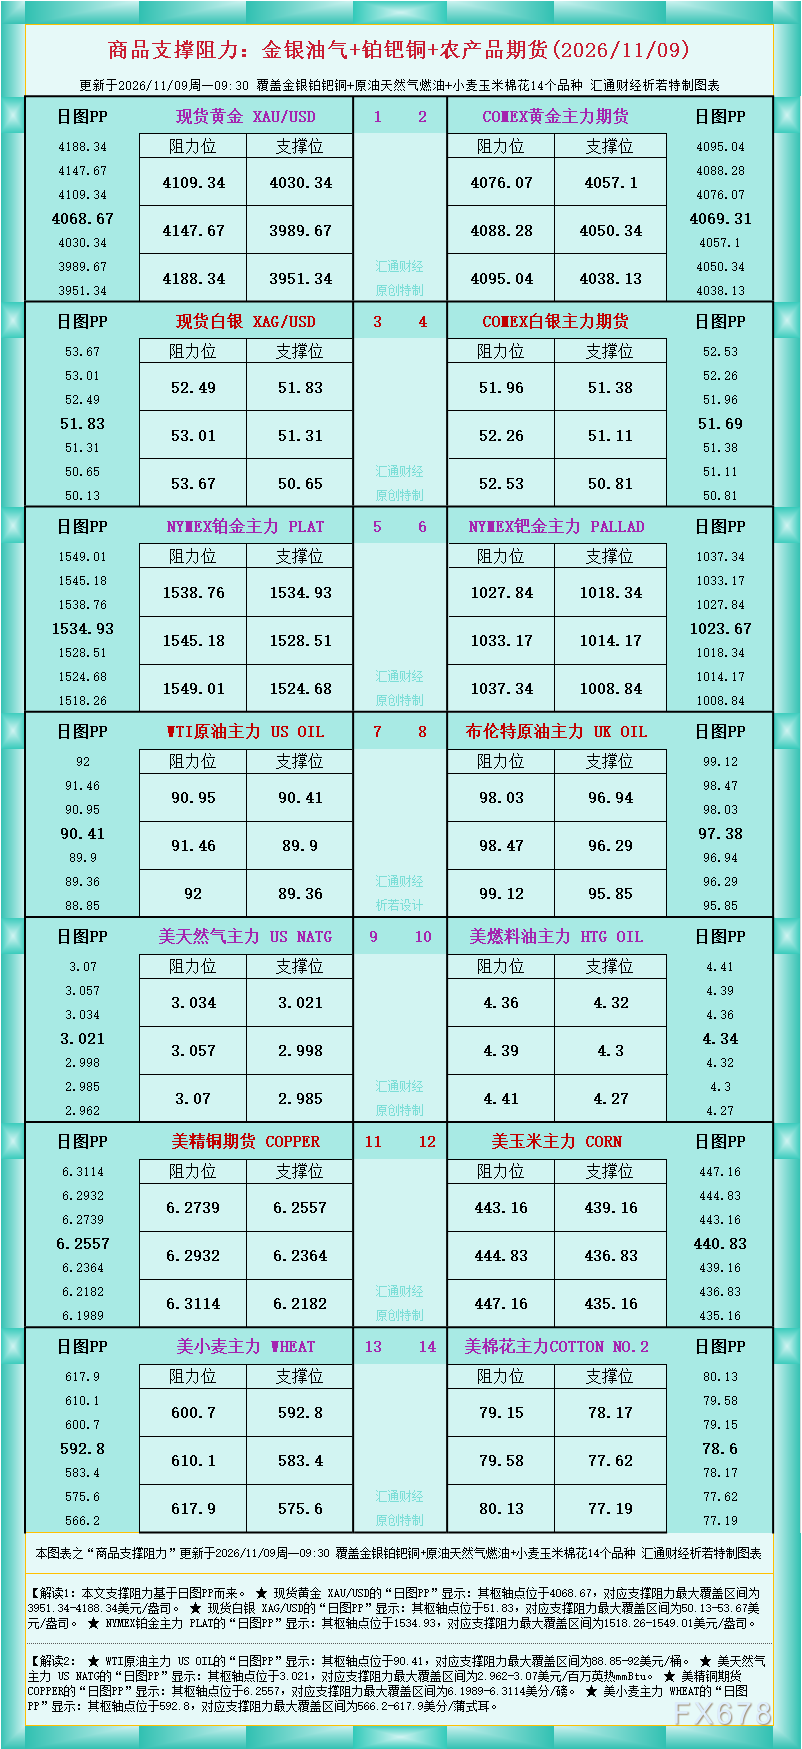
According to the chart data, Interpretation 1: The support and resistance in this article are based on daily chart PP.
★ The "Daily Chart PP" for Spot Gold XAU/USD shows: the pivot point is at 4068.67, with the main support and resistance range covering 3951.34-4188.34 USD/ounce.
★ The "Daily Chart PP" for Spot Silver XAG/USD shows: the pivot point is at 51.83, with the main support and resistance range covering 50.13-53.67 USD/ounce.
★ The "Daily Chart PP" for NYMEX Platinum Main Contract PLAT shows: the pivot point is at 1534.93, with the main support and resistance range covering 1518.26-1549.01 USD/ounce.
Interpretation 2:
★ The "Daily Chart PP" for WTI Crude Oil Main Contract US OIL shows: the pivot point is at 90.41, with the main support and resistance range covering 88.85-92 USD/barrel.
★ The "Daily Chart PP" for US Natural Gas Main Contract US NATG shows: the pivot point is at 3.021, with the main support and resistance range covering 2.962-3.07 USD/million BTU (mmBtu).
★ The "Daily Chart PP" for US Copper Futures COPPER shows: the pivot point is at 6.2557, with the main support and resistance range covering 6.1989-6.3114 cents/pound.
★ The "Daily Chart PP" for US Wheat Main Contract WHEAT shows: the pivot point is at 592.8, with the main support and resistance range covering 566.2-617.9 cents/bushel.
For more interpretations of other varieties, please refer to the chart.
Disclaimer: The content of this article solely reflects the author's opinion and does not represent the platform in any capacity. This article is not intended to serve as a reference for making investment decisions.
You may also like
Domestic sales "underperform," PepsiCo (PEP.US) launches mass layoffs of thousands in North America
PepsiCo North America has cut about 1,000 jobs to streamline operations, as beverage sales in the third quarter fell by 2% year-on-year and the full-year profit outlook has been revised downward.
WLFI: Token buyback will be carried out on Aster through a public wallet

Layer 33 calls for a pause on removing validators under the new Solana Foundation regulations
HIVE’s Bitcoin output jumps 49%, but mining revenue still falls
Crypto prices
More


