
Solana Wave 4 In Progress: Relief Bounce Or Setup For A Fresh Decline?

After a steep selloff that reinforced bearish momentum, Solana appears to be entering a period of consolidation as Wave 4 unfolds. Such corrective phases often offer short-term relief and can also serve as a launching pad for the next leg of a downtrend. As the market searches for direction, the key question remains whether buyers can build a meaningful recovery or if another decline is waiting around the corner.
Wave 4 Correction Takes Shape Amid Cooling Selling Pressure
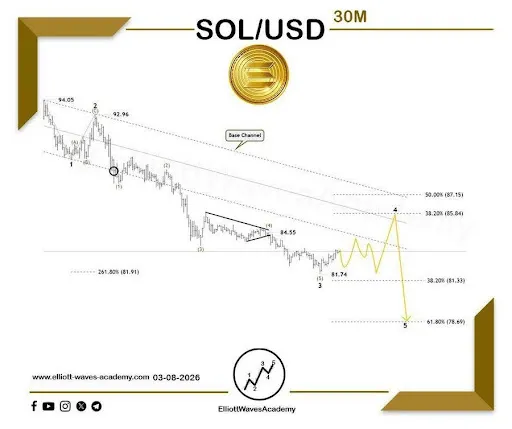
Analyzing Solana’s wave outlook on the 30-minute time frame, Elliott Waves Academy noted that the pair may be gearing up for another significant downside move following a decisive breakdown from its price channel. The recent decline has reinforced bearish sentiment, with price action signaling that sellers remain firmly in control of the broader trend.

According to the analysis, Solana has already reached the 261.80% Fibonacci extension level, suggesting that wave 3 has completed. As the strongest and most impulsive phase of the trend, wave 3 has played a key role in driving the current bearish structure lower.
 Source:
Chart from Elliott Waves Academy on X
Source:
Chart from Elliott Waves Academy on X
With wave 3 finished, the market appears to have entered wave 4, a corrective phase that typically follows an extended decline. Given the aggressive nature of wave 2 earlier in the sequence, wave four is expected to be more subdued, likely developing through sideways consolidation or a corrective triangle formation as the market temporarily stabilizes.
Once the corrective structure is complete, attention will shift to the next bearish leg. A breakdown below the key support level of the correction could trigger wave five, opening the door for a decline toward the $81.33–$78.69 zone, representing the next downside targets for bearish traders.
Three Months Of Consolidation Unleash A Powerful Breakout For Solana
Crypto analyst Daan Crypto Trades pointed out that Solana delivered the expected 20–30% move after finally breaking out of its multi-month trading range. Such explosive price action is often seen after extended periods of consolidation, where volatility remains compressed before a decisive breakout triggers a strong directional move.

The analyst emphasized the importance of waiting for confirmation. Once price escapes a range that has held for more than three months, momentum tends to accelerate rapidly, creating sizable opportunities for traders who react to the confirmed move rather than trying to predict it.
Solana is now retesting a crucial weekly support level. According to Daan, this area represents one of the last major support zones on the chart, making it a critical battleground for bulls. Holding this level and reclaiming key horizontal resistance levels above could help restore bullish momentum and strengthen the case for another upward leg.
Disclaimer: The content of this article solely reflects the author's opinion and does not represent the platform in any capacity. This article is not intended to serve as a reference for making investment decisions.
You may also like
WTI posts modest gains above $88.50 on unexpected EIA draw, Middle East conflicts in focus

Betting on 'U.S. Treasury yields plunging', bullish options trading volume for long-term U.S. Treasury and utility sector U.S. stock ETFs surges
The increasing activity in long-term U.S. Treasury options “very directly” reflects traders’ expectations for a decline in long-term interest rates. Utility stocks have added a new logic due to rising power demand from AI data centers. Historically, whenever U.S. Treasury yields retreat, these two sectors are often the first to benefit and see sharp rebounds. Analysts believe that the battle between high interest rates and the AI frenzy has become the core narrative in the current market.
Impact of Surging US Treasury Yields: US Stock PE Ratio Shrinks Significantly, Mag 7 Dominates Small Caps
The 10-year US Treasury yield has reached a 24-year high, quietly reshaping the landscape of the US stock market. The S&P 500 forward price-to-earnings ratio has compressed from 22.2 times at the beginning of the year to 19.3 times, marking a “three-tier decline in valuation.” Meanwhile, the Russell 2000 Index is approaching technical correction territory, while Mag 7 stocks like Microsoft and Nvidia continue to support the broader market with the AI narrative and strong earnings. Market concentration is nearing historic extremes.
Has the "only buyer" of Korean stocks left early?
Over the past two months, Samsung and SK Hynix have alone absorbed over $25 billion in sell pressure. Now, Samsung Electronics has completed its buybacks ahead of schedule, and SK Hynix is left with only about $500 million to finish up. On their "exit" day, the KOSPI instantly dropped by 2%. More dangerously, Samsung's Q3 results missed expectations for both revenue and profit. Coupled with ETF rebalancing and options expiry, a "liquidity vacuum" has become a reality, leaving the question of who will step in as the biggest mystery.
Crypto prices
More


