Li Ying Crypto Talk: 11.2 Latest Market Analysis for Bitcoin (BTC) and Ethereum (ETH)
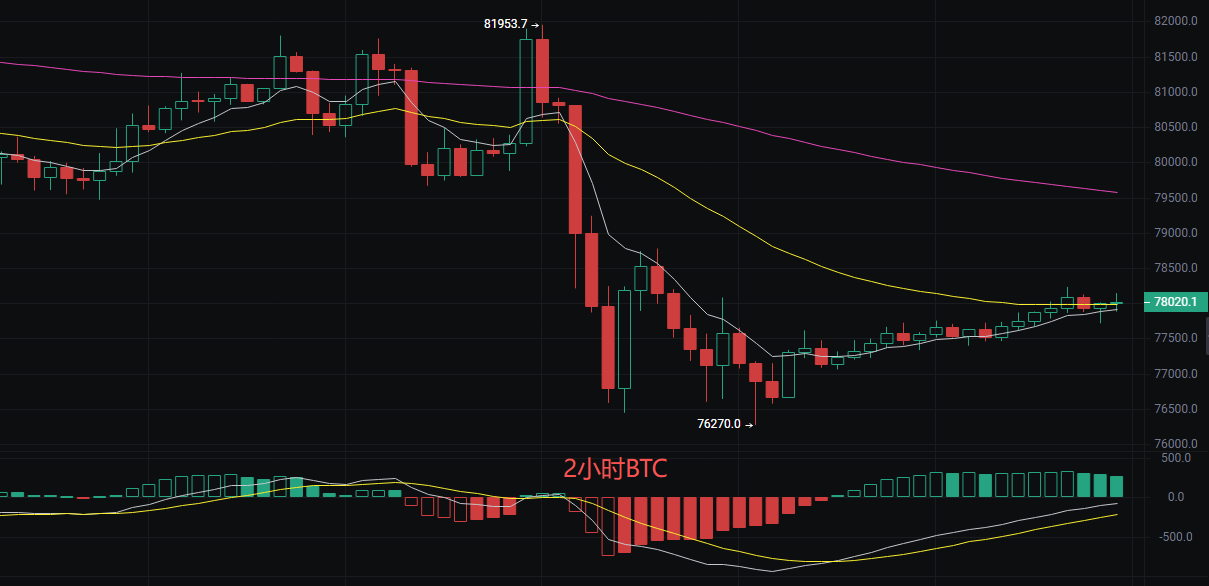
Everyone! The current price of Bitcoin is 78,000. In the past two days, although the trend hasn’t completely reversed yet, the waterfall-style drop has stopped. Now the price is stable around 78,000, like someone slowly recovering from injuries. The current market is a typical oversold rebound, with resistance above and support below. What we need now most is patience—don’t get overheated and chase just because it went up a little, and don’t panic sell at the bottom because of previous drops. It’s all about mindset right now. As long as we stay steady, there are still opportunities. At present, the candlestick pattern is trying to repair the trauma of the previous plunge. The short-term EMA moving average is strengthening, and there is a clear divergence structure at the bottom of the MACD indicator. The price has already broken strongly above the middle band and is standing firm, currently testing the upper band resistance at 78,717. If the Bollinger Band expands further, the upside potential will open up.
Long/Short Trading Strategies
Long: Enter if stabilization occurs at 77,500–77,600. Set stop-loss at 76,000 to guard against a double bottom. Initial target at 78,700–79,000; if it breaks through, look to 79,500.
Short: Set up short positions at 79,500–79,800. Stop-loss above 80,200, target a retracement to 78,000.
Li Ying Reminder: In rebound markets, be quick in and out with shorts; for longs, hold and observe for a breakout.
Ethereum
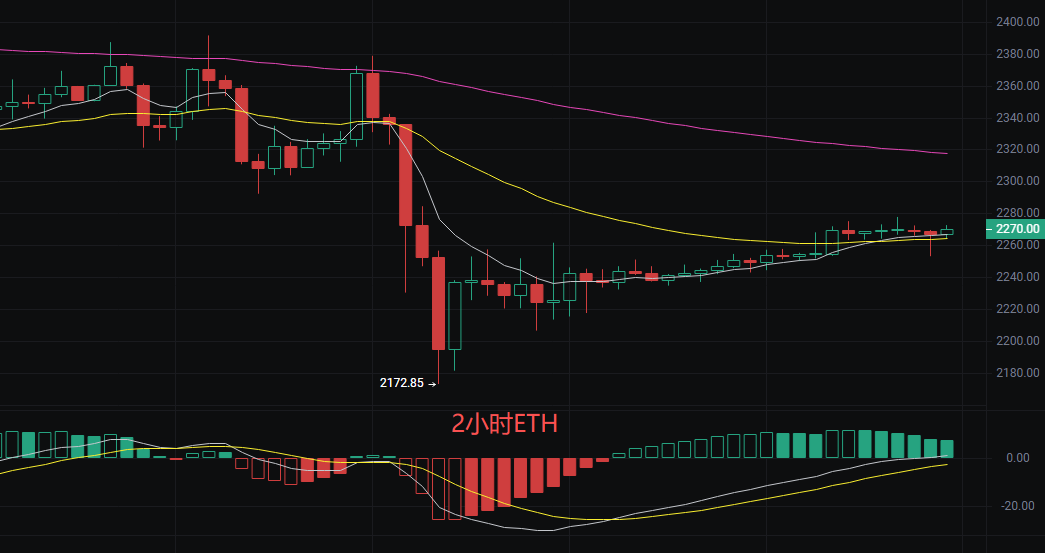
Everyone, Ethereum’s current price is 2,270. It looks stable, but in fact, it's still in the ICU observation period. The long-term moving average is pressing overhead, like a strict school disciplinarian—unless it breaks through, everyone has to keep their heads down. The good news is that a few short-term fast lines have started turning upward, indicating that capital is quietly accumulating and doesn’t want the price to fall further. The current pattern is brewing a market turn. The EMA moving averages have formed a short-term golden cross resonance, and buying power is taking the advantage. The upper EMA120 is presenting a very strong dynamic resistance; this is the crucial hurdle the bulls must overcome. MACD is trending upward, indicating the bears are running out of strength and the bulls are trying to take over. The middle band is around 2,256. The price is now between the middle band and upper band at 2,278—a typical accumulation pattern. Once the Bollinger Band expands upward and the price stands firm above 2,280, a new round of uptrend will be confirmed.
Practical Trading Strategies
For conservative traders, place pending orders on a pullback to 2,255–2,260. Stop-loss at 2,240; initial target 2,280; if it breaks, look to 2,300–2,310.
If a rebound encounters resistance at 2,315–2,320, consider short positions. Stop-loss above 2,325, target retracement to 2,280.
Li Ying Reminder: If 2,250 middle band support holds, short-term bias is bullish. If it falls below 2,240, the trend turns bearish and you should exit and wait.
The above content is original by Li Ying. Please indicate the source when reposting! There is a review delay for article releases; the market changes rapidly, so the above suggestions are for reference only and at your own risk.